Posting an EOD 5 min chart with notes on my thought process intraday on seeing the price moves and the result....

60 min Chart


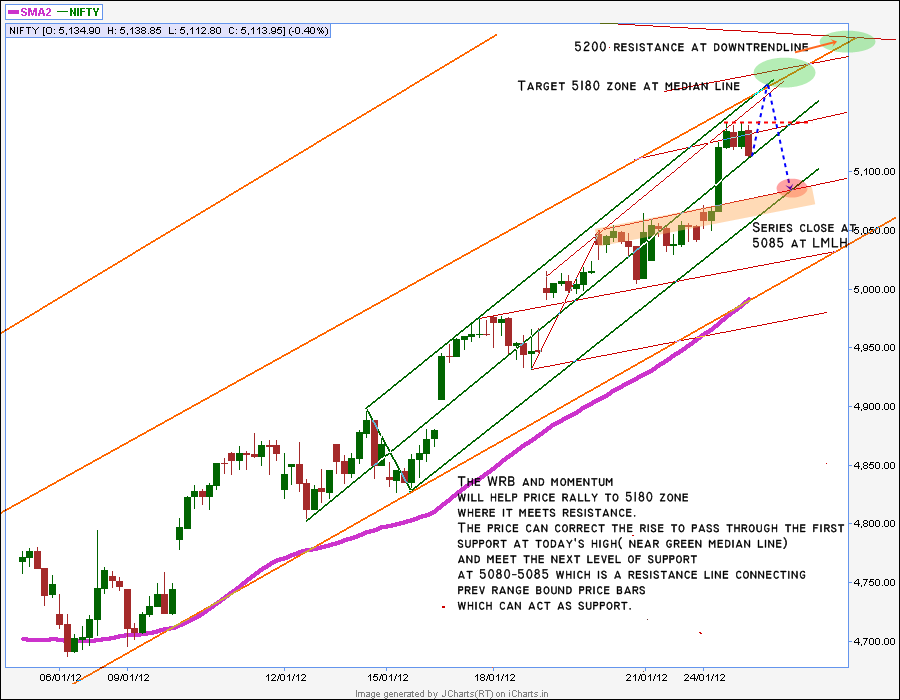 If Price hits the 5180-5200 zone, it would be another example of the magic of median lines :).
 Still in indecision zone.Is Nifty waiting for one more batch of buyers to push it to the top or will it back out in its rally tommorrow.No clue as per charts but very close to the initial testing of the breakdown point from the Green LMLH.Looks like there may be another day of testing the support levels.Longer it takes, the upward move prospects will be brighter rather than the correction to the current rally.


 On Monday price was still at a critical area where bulls and bears were fighting it out .The close was positive and it emerged that the bulls had an upper hand when the price was pushed from the early morning lows to close at the day's high zone.Still the outcome could have been either way and the bulls won today with the breakout above the resistance area.What a breakout rally!
 Price did finally break out of the resistance at 4880 to reach 4900 zone and closed positive for the day.The zone is still an indecision zone if we go by PF analysis.
 EOD 5 min chart and projections for next day
 60 min chart
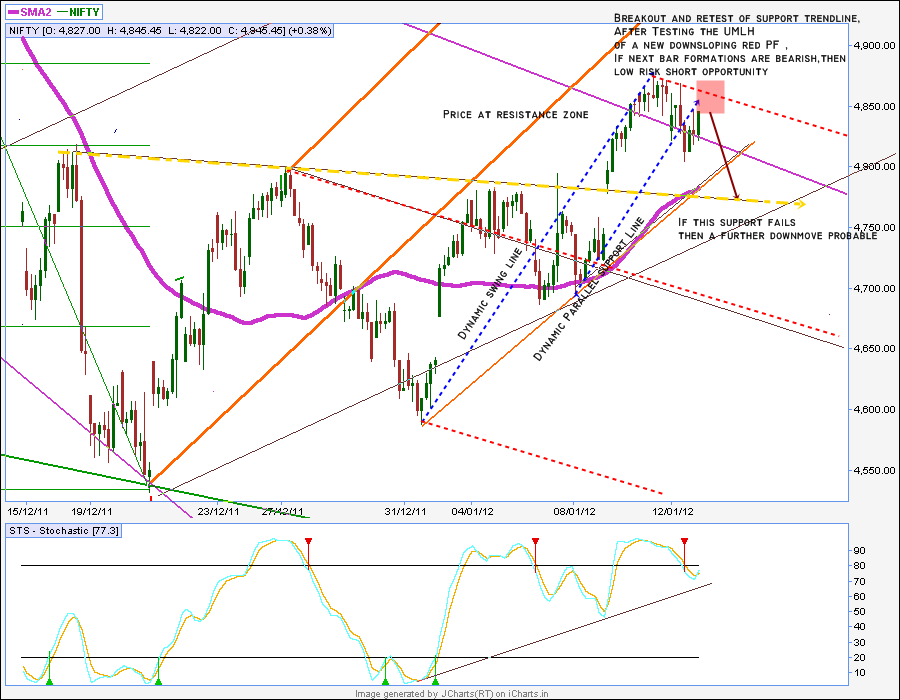


 60 min chart


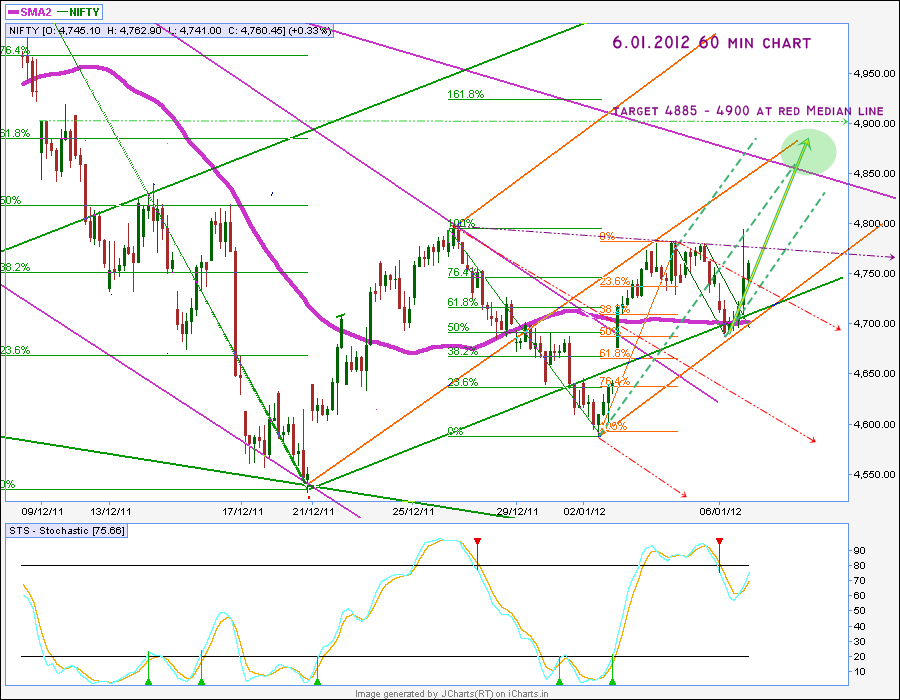
 Nifty playing hide and seek today:)).Moving up towards resistance of range made yesterday, giving hope of a breakout and reversing down.Tested the low of the range enticing a breakdown ..last hour bar a green bar and the day ends with no conclusion of its mood.
 Price met with resistance at the Median line at 4785 zone .Today's move was more of a consolidation day in a wider range after the huge rally.The range formed today is between 4780-4730 zone which is what we'll have to watch out tommorrow.


