Trading with Median lines is a system and a leading indicator suitable for Swing trading.I am following this strategy for Nifty and Bank Nifty with good results.Those interested to trade with Charts and Price action to analyse target price, support and resistance levels will find this strategy very interesting.
Feedback welcome!Happy trading...
Monday, October 31, 2011
31.10.2011_Monday
Drawn a minor ascending Pitchfork ( pivots matching OB / OS in stoch)to assess the downside supports for the consolidation area.Price attempting to close the gap can retrace till the point where it meets the ascending trendline from previous two minor swing highs.5200-5250 zone is probable support area.
Friday, October 28, 2011
28.10.2011_Friday
Strong global cues obviously gave momentum to the rally today, though expected to rise but not as fast as it was with the gapup till 5380 levels. Price hit the major red median line exactly and rangebound through the day.No intraday signs of the upmove waning, so will hold the longs with hedging till the chart patterns emerge.
Thursday, October 27, 2011
27.10.2011_Thursday
Tim Morge,the expert trader ,(www.marketgeometry.com) from whom I have self learnt the method of using median lines,explains the way in which the market map is drawn and area of confluence of supports and resistances are identified.His motto is to be very patient, to identify an entry point with the smallest risk and entering the trade only after price action confirms the test / retest of the lines.He teaches how large institutional buyers , the Whales wait to "gobble"up the small fish at previous supports and resistances.The first instance of a breakout, one see's a rush of buyers / sellers ( upside/ downside breakout ) to enter not wanting to miss the momentum.But , many instances it is seen there is a pullback to the earlier breakout point ,dropping off the breakout traders, pulling out their stops.and continues with a small consolidation or range bound movement.The breakout of this range / consolidation gives a better entry point and confirms the change in behaviour / trend in the particular timeframe.
Attempting to map the Nifty's recent price action with a Multipivot median line - this is another tool in the median line method.( drawn it on a 30 min chart so that my 60 min chart studies can be maintained).The breakout of the stiff resistance gave a rally to 5200 levels.How will Nifty move on from here? What are the probable trades possible within the existing market structure.Here is my take...
Tuesday, October 25, 2011
25.10.2011_Tuesday
Monday, October 24, 2011
Friday, October 21, 2011
Thursday, October 20, 2011
20.10.2011_Thursday
Judging the corrective phase or working out the levels is never easy!
But today the junction of the Downsloping Blue PF and upsloping Magenta PF gave a good support of today's low where it took support and turned up.
The triangular formation is going to drive us crazy till it clears this corrective phase.We'll have to take it one day at a time ,I suppose
Wednesday, October 19, 2011
Tuesday, October 18, 2011
18.10.2011_Tuesday
The rally lost steam and could not rise till 5180 levels as expected.However the slowing down of the price moves near the median line and the H & S pattern of median lines gave clues of a short term reversal.
Today's price reached the Blue lower median line parallel drawn with the recent minor swings of the rally at 5000 zone as expected. So the correction to the recent rally expected to continue for the next few days.The last three hour bars give an indication of the second wave of the correction which can oscillate around the 5050 levels to reach 5100.This point would be another spot where a short can be considered based on price bar patterns.The resistance at 5100 can lead the price down towards 4985 / 4950 which corresponds to 38.2% of the rally and would again be a good support level to enter Longs.
If 4950 fails, then 4900 would be the next support area, which is at the Lower median line of the Red Pitchfork drawn on the daily bar chart.
Alternate view is if price moves past 5100 with momentum, the downmove will get negated.
Monday, October 17, 2011
Friday, October 14, 2011
14.10.2011_Friday
WEEKLY CHART ANALYSIS
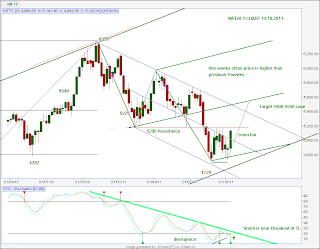
After a double bottom formation this week's candle is a wide range green bar / ZOOM bar crossing the blue median line.The sign of a positive rally to come.
In the chart I've drawn a upsloping green pitchfork after this weeks' higher close.The close , the highest in 9 weeks !Expect the 5200 resistance to be broken through and price to progress towards the targets of 5500-5550 zone in the next few weeks.
The Stoch indicator line is nearing a breakout of the Trendline and indicator is showing divergence at the double bottom, two positive signs for the upmove to commence.
In the New Pitchfork there are two tests of the Green Lower Median line in the previous two weeks , and coupled with the strong green bar today, Weekly trend is turned UP.
DAILY CHART ANALYSIS
The same pitchforks drawn on the daily chart.
Price has broken out of the parallel line drawn parallel to the pivots of the major previousdown swing.
Price has moved above 50 sma and above the red downsloping median line.
It is close to the previous resistances / double top but the momentum of the previous five day movement is expected to break this resistance.
60 min chart
Price moving up within the ascending Pitchfork , beyond the Median line, retracing and taking support at the green Median line , retesting it and closing close to the high for the day.
The momentum should take the prices up towards the 5180-5200 which is junction of Warning Lines/ Fib extension lines , Fib extension of 161.8% of previous swing.After that the next target is towards 5300 zone where there should be pullbacks/consolidation since it hits the downsloping red Upper median Line shown in chart.
Thursday, October 13, 2011
13.10.2011_THURSDAY
Price is in a short term uptrend as per median lines drawn with higher highs and higher lows and above 50 sma in hourly chart.The pullbacks on tuesday and thursday did not cross the previous day's 50 % range , so I'm still positive about the uptrend.
Today's low has just touched theGreen Main median line.Supports are expected at the 5050-5030 range ( previous swing tops / resistance ) which would also be considered as a pullback to the Long term Red Median line.Next higher targets are at 5180 zone where there could be some range bound consolidation and then a final surge towards towards the 5300 zone.
If 5050-5030 zone fails to give support and goes below 5000 then we'll have to go with the opinion that a short term high at 5135 zone has set and look for pullbacks to short the nifty.Confirmed trend reversal will be when price crosses 4925 on the downside.
Tuesday, October 11, 2011
Monday, October 10, 2011
Saturday, October 8, 2011
8.10.2011_Bank Nifty
Median Lines and Stochastics for finding Trade entries and targets.
Attached is 60 min Bank nifty chart , where the method of finding trades using combination of [B]Median lines, Stochastics and 50 sma[/B] is explained.
The point emphasised is to be on the lookout for a confluence of triggers like Horizontal resistance / support lines with stochastics OB / OS zones and the meeting of price bars at the Median Lines,Upper median lines,Lower median lines .
The trades with entry points with a stoploss point giving a higher Risk:Reward ratio of minimum 1:3 are to be taken rather than with a lesser ratio.
Friday, October 7, 2011
Thursday, October 6, 2011
Subscribe to:
Posts (Atom)