
Monday, January 31, 2011
31.01.11
 Steady down move has reached very close to the Major Lower median line of the major pitchfork.Today price opened low and closed higher, close to friday's close.
Drawing a downsloping Yellow Median line from recent pivots , todays low has reached a Fib line parallel to the median line.The bounce comes after three days of downmove.The bounce can reach next upto 5565,5610,5656 which are the Fib levels of the current down swing.
50 % R of this swing is at 5610 levels, above which it can go up to 5656.The downtrend holds till it crosses 5801 , pulls back , makes a higher low and then moves higher.
If the price breaks today's low of 5417 , lower level of 5315 is the target.
Friday, January 28, 2011


Thursday, January 27, 2011

27.01.11
 The price was not supported on the White LML today.The first half hour it retraced into the channel but fell down steadily to meet the Warning lines 1 an 2.Drawing a Blue Median line and parallels,Price has closed at the Blue LML EOD.Stochastics are at oversold level.
Low of thsi swing can be confirmed after higher low bars and price closing above 5 ema.
Pullback till 5680 possible for tommorrow if bounceback rally happens
Tuesday, January 25, 2011
25.01.11
 Long position taken at 5750 levels was stopped out.It was a high risk trade and the market proved it!!
A new channel (white) connecting the highs of the two down swings is drawn.The lower parallel line meets the EOD price.Will this support line hold well.Will have to watch on thursday....
Monday, January 24, 2011
Trade Setups - Higher Low Setup
 Example chart above:Bank Nifty 30 min chart
Higher Low Setup / Retest of Lower Median Line
This is a classic setup of median line system.The rules are my own.
Rules for this Setup
- Identify a downswing, a counter upswing and again a pullback.Draw a Median line set with prev Major three swing pivots ( P3 will be end of the downswing or viceversa)
- Wait for the price to test the LML and move upwards.
- When price crossed 50 % of the pullback which tested the LML Buy position entered.If the price crosses 50 sma it adds to the positiveness of the trade.
- Stoploss will be below the test bar low or low of bar below 50 sma.
- Targets will be 1.Median Line meet of price, 2. Previous Swing high for Long positions / Low for Short positions , 3. Upper Median Line / Lower median line.
- Trailing profits with 5 ema / 10 ema or 5/ 20 ema crossover.
Update on 25.01.11

Took add position at 11,100 levels at expected median line support which was stopped out at stoploss level of 11,000.The support levels to be watched for price action for next move.
Trade Setups - 50% R in Pullback


Stock charts with 50 % R Pullback setup
My rules for this Setup
- Identify a Up or down swing.Wait for a pullback thro 50 sma.The distance below and above 50 sma to be more or less equal.
- Draw a Median Line thro the pivots of the pullback swing.
- If downsloping Pitchfork then Short or vice versa.
- When price crosses 50 % level of pullback swing and 50 sma, Sell in downsloping Pitchfork / Buy in upsloping pitchfork.
- Stoploss level will be at bar high above 50 sma level
- Risk/ reward to be calculated before entry.1:2.5 -3 minimum to be maintained.
- Target levels will be Target1- previous swing low or vice versa,Target 2 will be meeting point at Median Line and further down at LML.
- To trail profits , Stoploss of close above / below 10 ema , (or ) 5 / 20 ema crossover to be used.
24.01.11
daily Chart 24.01.11

The past two day movement was range bound and the mood of market was difficult to judge for initiating new trades.Prices hovering near 50 Sma formed a flag like formation near the TrendLine break.However the low of pullback was not confirmed at EOD.
Today's move above friday's high touched the median line and moved much higher to reach 5750 levels.This corresponds to the previous swing high, which is a target level.
Small pullback at 5750 levels till 5721 and EOD at 5742.
For tommorrow buy at 5750 for target 5850 as projected with MINI median line.Stoploss level will be 5715.

Thursday, January 20, 2011
20.01.11
30 min chart 20.1.11
Prices did not move towards White median line as expected.The move down earlier in the session was a sideways move and closer to the white UML.This type of move indicated there is a change in the market mood and post 2 pm the swift upmove above the Green UML and above the 50 sma confirmed the minor reversal.Closed my short position as it was close to my stoploss point though the commencement of any uptrend is yet to be confirmed.Will enter longs on pullbacks tommorrow.
 Daily Chart 20.1.11
Drawn a schiff median lines from the recent pivots.The target of price meeting LML at around 5500 levels is still not reached.Todays positive move after a lower open and closing higher than yesterday indicates a minor reversal.Whether the low has been done for this swing will be confirmed only if todays low is protected for the next few days.Resistance are at 5850 - 5900 levels if todays upmove continues .


Wednesday, January 19, 2011
19.01.11
DAILY CHART 19.1.11

30 min chart 19.1.11
 Price met resistance at the sliding parallel line drawn on yesterdays chart.Moved down below 5 ema / 20 ema and near 50 sma poised for crossover. Drawn a white ML from P4 with swing pivots P5 and P6 ( todays high) This being a high probability setup , test of the UML will be a good entry point for short position.
Levels for shorting are at 5710 - 5730 levels.
Targets will be previous Swing Low - P5 - 5622
Next target will be Price meeting of Median line .Projecting equal price and time projection of previous parallel swing towards the White median line gives target projections of 5530 levels.Further below meeting of Sliding parallel line will give 5500 levels.
This corresponds with the levels projected with Median lines in the Daily chart earlier.
Tuesday, January 18, 2011

Sunday, January 16, 2011
Trade Analysis-Nifty 14th Dec 2010-13th Jan 2011
30 min charts with Median line Entries and exits


My charts with median lines for this period with trade entries and exits with the median lines .
Saturday, January 15, 2011
Trade Analysis-TataMotors


This is my detailed analysis on going through a chart using Median Line system to find long and short trades and the results.
The chart posted is Tata Motors 30 min charts.
Friday, January 14, 2011
Trade Setups - Retest of UML

15 min chart 14.01.11 @ 11.15 am
Analysing Chart with median lines for high probable trade setups .
Red ML drawn from Swing high of 6178 thro swing P1 - P2.
Trend indicator - 50 SMA
Indicator STH 35,3,3 setting - For oversold / over bought indications / for confirmation of entry / exits.
EMA - 5-20 crossover - price crossover from top or bottom for short / long entry
Analysis
After drawing the red ML, The price has not crossed the pivot at P2.The price tested the UML parallel and next bar closing below the test bar.
For taking the trade the following parameters are used.
- Downsloping median Line - So Short trade.
- Low risk with tight stoploss at entry below low of test bar
- Confirmation and adding to position at crossover of 5 / 20 EMA from top.
- Price closing below 5813 ( median price of week high / low ) and closing below 50 sma gives confidence in the trade.
- Target 1 is range of P1-P2.The point reached at the median line was equal to this range.So profit booked for this time frame.
- Drawing a Blue Up sloping median line to chart the upmovement.
- Resistance expected at - downsloping Red UML parallel / 50 sma ( for 15 min Time frame)
- 1.Price reaches 50 sma and moves downward.Enter at test of UML and close below test bar
- 2.Price moves up till higher resistance levels / previous swing pivot high - 5875 / Blue median line test , moves close below test bar and 5 ema moves down and crosses thro 20 ema -STS and crosssover down will add to confirmation of trade.
- Target 1 will be range of previous swing , then range of parallel swing with trailing stoploss.
- Above Pivot P2 , the short trade lookout will be closed and look out for long trades.
15 min Chart Update @4.00 pm

The price moved well above 50 sma upto the Blue Median line and turned downwards.Took the 1st position trade close to the 5800 NF level .Went for a short lunch break and missed entering after the 5/ 20 EMA crossover.The price fall was so faaast !!
Drawing another orange Median line once the price crossed Blue LMLparallel.
Right now the price is close to the downsloping red median line where it can pause for some time and then continue its move downwards towards the lower daily targets.
The lower target of 5533 is very close , just about 100 pts away.So close trailing stoploss to be maintained.
Looking forward to the upward journey also once this downtrend is over.:-)
Thursday, January 13, 2011
13.01.11
The price move was 1.9% down today . ( it was up by 1.9 % yesterday)Really fast work Nifty!!
This seesaw movement shows the indecisive mood of the market.The probabilities are
Above 5815 it can move higher to the upper resistances.
Below 5700 it can move lower towards 5533 in a few days.
To decide to be on long or short side is a tough decision.Past month though the swings were large due to high volatility very difficult to pin down on correct entry and exit levels.I have also made a few good and bad trades due to this situation and will reenter after the uncertainty clears up.
The predominant feeling is that the market is yet to bottom out / downtrend is still on and the past few day movements are corrective short term waves / zig zag move upwards.
The resistance levels will have to be closely monitored as when the fall happens it will be very fast and one has to enter quickly into the move.
60 min chart
 Daily Chart
Wednesday, January 12, 2011
12.01.11
60 min chart
The pullback after mid day was swift and closing at 5863 up by 1.9 %.The price has crossed above the resistance of the red Median line.
The positive close will push the prices up till 5950 levels where it meets the resistance of the orange Lower median line parallel.
The down trend is still not negated till firm close above 5950.
Todays high has tested the orange LMLH . If any price fall happens at this levels it will be very fierce and fast just as it went up.
Will be cautious for both counts.
 Daily Chart 12.01.11
Tuesday, January 11, 2011
11.01.11
DAILY CHART

60 MIN CHART
 Nifty moves were volatile today.This type of movement is referred as Energy Coil by Tim Morge,a leading expert in median line method.The movement concentrated around the median line as if buyers and sellers both indecisive and pulling each other. Price did not move above the median line for a full 60 min bar.
 The expectation is this move can continue in this manner for a day or two before the final selling climax.
Daily chart can see that todays high has tested the orange median line sliding parallel in the morning session and continued lower and closed negatively confirming lower levels are expected.
Tommorrow's price action is crucial for clues of the end of this swing .
Monday, January 10, 2011
10.01.2011 Nifty
Daily Chart
The price has moved very strongly below the Lower Median line.This shows the confirmation of the weakness of the index in the short term.6178 should become the Lower High if price moves downwards tommorrow.The target for the Lower low is analysed with the 60 min chart.
 60 min chart
Worked on two probable Median line projections
Option 1
Marked as A,B,C which are the anchor and swing pivots thro which the Blue ML is drawn.
The price is moving towards the Median Line .The target projections equivalent to range AB = 645 points from 6178 will lead to 5533 .
Option 2
Marked as A1,B1 ,C which are the anchor and swing pivots thro which the red ML is drawn.In this scenario, price has zoomed thro the median line.The targets are the red Lower median line parallel.This is worked out as 2 x range of A1B1.This swing equals to 348 points x 2 = 696 points.The down target in this case works out to 5482.The warning line of the orange pitchfork is also drawn with distance at range = 1/2 of AB.This line will be a support line for the price move down.
In weekly charts 5570 is the 50 % R of the major swing from 4787 - 6336.
So the major levels to watch are 5570 - 5533 -5482.Price action around these levels will indicate the next swing move.
Outlook for tommorrow.The downside targets are as above.The price action is expected to continue as fierce as the past two days.
Saturday, January 8, 2011
8.01.11 _Weekly chart
- Weekly bearish engulfing Bar.
- Close below 5 WEMA.
Price has crossed the LML of the orange Pitchfork.Drawing a new downsloping red pitchfork, the down target for the swing down is 5570 levels.This corresponds to the 50 % R of the upswing from 4787 to 6336.
A retest of the junction of orange LML and red UML at around 6035 - 6070 levels will give a good opportunity to sell again.Price action of bars at these levels will give the confirmation of the downmove.
Above 6200 the downmove probability is reduced.

Friday, January 7, 2011
7.01.11-Nifty's steep fall


The Move of Nifty was really swift and steep today.Expected a small bounce today but the markets makes its own moves.The price moved past 5950 which was the extreme support expected for today and closed at 5888.My shorts were closed yesterday anticipating minor pullback today and alas,I missed a good 50 % of the downmove :-(( .It shows the need to follow my rules and not get swayed due to intraday actions .Learning everyday....
The Lower Median Line is the next support level at around 5850 .This swing down is an exact parallel move of the swing down from 6070 to 5721 .Expecting supports at 5850 levels and on confirmation of entry triggers ie crossing over of EMA's in the lower timeframe and higher time frame , will enter new long positions.
Thursday, January 6, 2011
6.01.11 Nifty continues its move down
60 min chart
Price moved further down and has hit the 23 .6 % Fib line support within the lower channel.A bounce at these levels upto UMLH is a possibility.If the price is resisted at 6120-6135 at the UMLH and falls another short term swing down is expected.
 Daily Chart 6.01.11
Next levels expected is 38.2 % R @ 6000 levels and further down 50 % support @ 5950 levels


Wednesday, January 5, 2011
5.01.11 - Nifty short term reversal
Following up on yesterday's 60 min chart,the price crossed 6100 / the minor trendline ,retested it from below and closed at 6078.
60 min chart
 Daily Chart 5.01.11
The next levels to look out for is 6005 - 38.2 % R levels from recent swing high.There is a cluster of price bars between 6045 / 5950 and this region can be a good support.

Tuesday, January 4, 2011
Nifty ..is it reversing ?
60 min chart 4.01.11
The price move was in a wide range and was supported on the LMLine of Green Pitchfork.The price movement in this lower channelof Green PF did not meet the Green median line and was usefull to study the support levels only.Now closer to the main Median line (orange) the prices have drifted downwards.Connecting the latest high with the previous high at 6070, the trendline is parallel to the Orange median line.Within this swing connecting highs / higher highs and low/ higher low and drawing trendline channel , probable support 1 comes at around 6100.
What if?
If the recent high is at 6179 , where can the prices move to.?Drawing a Blue pitchfork from Anchor at 6070 thro midpoint of recent swing pivots , the price has tested the UMLH of this bluePF ,moved down,retested and closed lower for the day.Target projections towards Blue Median line is very close to the Major Orange PF LMLh at around 5880 - 5850 levels.
 Daily Chart 4.01.11
 Fib R levels marked in daily chart.These levels correlate with the confluence of median lines/ fib median lines and warning Lines.
The probability for moves downward is more as the price at overbought levels in 60 min chart and correction to previous swing expected.
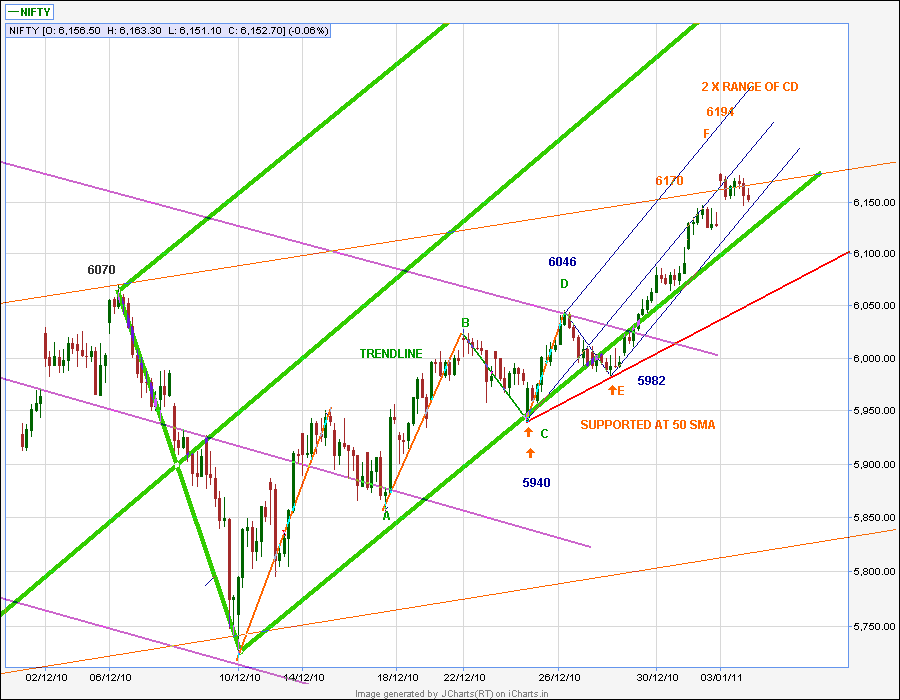
Monday, January 3, 2011
Nifty meets minor resistance..
Nifty moved within a range today as early session gapped up and met the minor median line.The price move is still within the ascending blue pitchfork and has support at the major green pitchfork LML also.
60 min chart

Daily chart

The warning line 2 is also drawn on the daily chart.The confluence of the present Major pitchfork Fib R lines and the warning lines gives targets of levels close to 6200 , 6240 , 635o , 6420- 6430.The immediate targets of 6200 6250 are near the major Green median line and expect resistances at these levels. Range bound movement is probable.
On strong close above 6250 higher levels at junction of PF and warning lines are to be the targets.
Supports below are quite far away at 6045 - 5950 levels.So at median line resistance part booking of long positions to be done.
Subscribe to:
Posts (Atom)