Trading with Median lines is a system and a leading indicator suitable for Swing trading.I am following this strategy for Nifty and Bank Nifty with good results.Those interested to trade with Charts and Price action to analyse target price, support and resistance levels will find this strategy very interesting.

Feedback welcome!Happy trading...

Tuesday, November 29, 2011

29.11.2011 TUESDAY


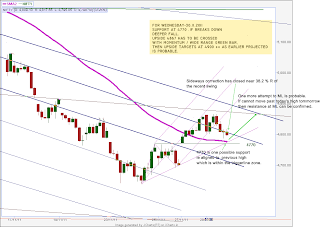
It was a disappointing day,as after the rally yesterday, a follow up upmove was expected atleast till 4900 zone , but the open itself was with a big bang but on the downside. Assuming it is a 4th wave from the recent major low, it can close near the wave 1 high to conform with a simple EW count.This falls within the trigger line zone from the magenta PF from recent swing pivots.
So two probable moves for tommorrow.
1.Price supports at 4770 area and turns up towards the ML resistance.
- Morning session, if we have a hammer bar at 4770 zone , WRB crossing the previous bar with the recent low, a long can be entered.
2.Price breaks down through 4770 support line.
- this if it happens in the later session, it would be more convincing for a greater downmove, as price would have earlier attempted to climb up and then unable to do so, breaks down the 4770 area.

It looks like we're going to see a complex correction with lot of smaller waves moving up and down, and guaging the trend to trade in the short term is going to be difficult due to whipsaws till the trend can be confirmed.
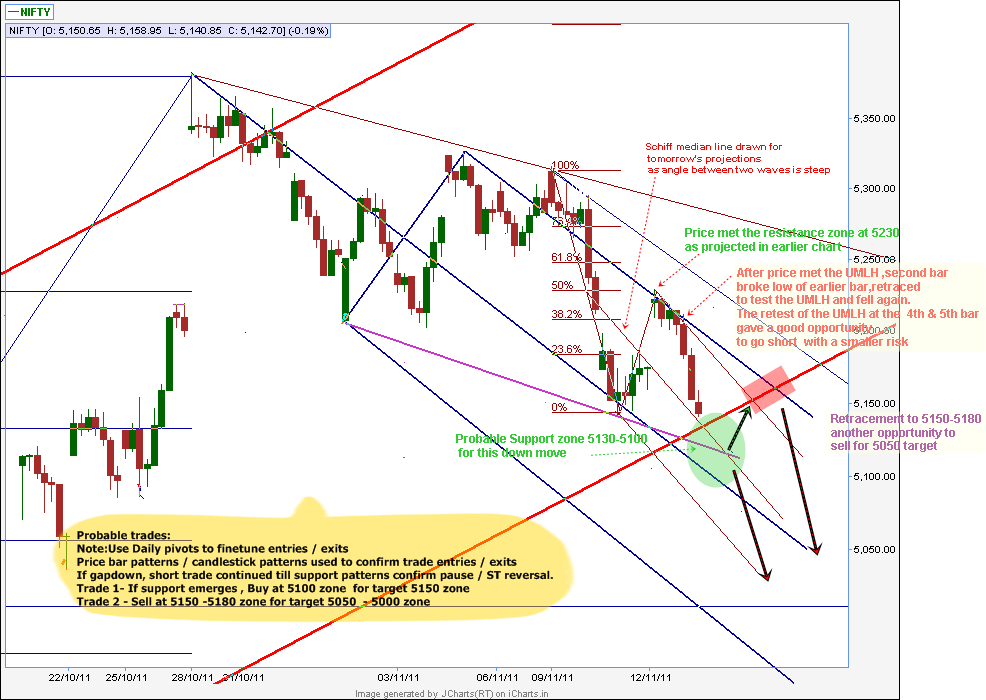
Monday, November 28, 2011

28.11.2011_Monday

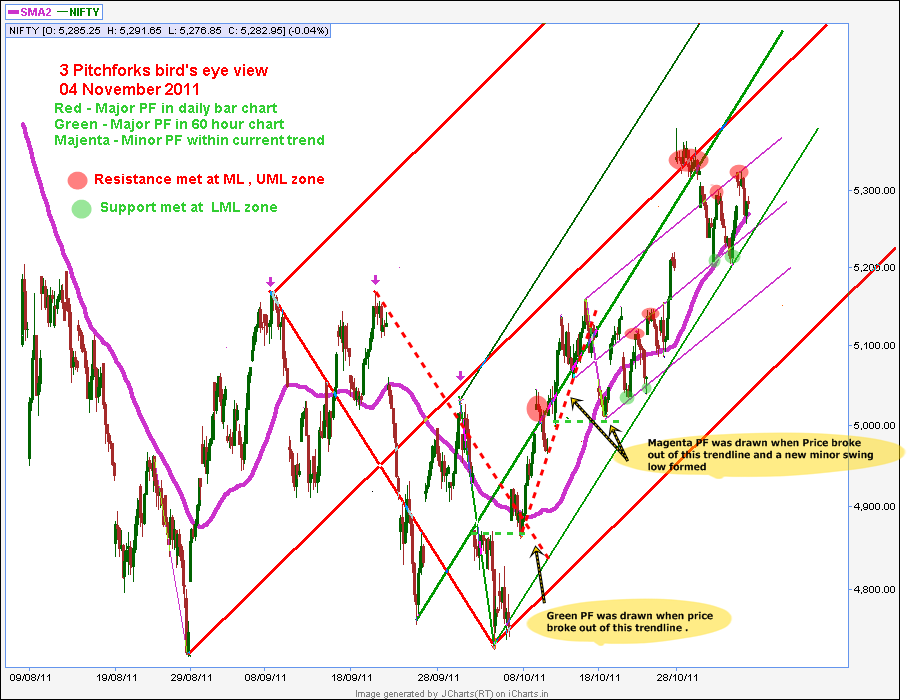
4660-70 levels were held and price gapped up and had a good price rally of 3 % today...
Higher end resistances are 4906 / 4915 / 4986 .
If this is a pullback rally these are the resistances where the reversal can happen as the downtrend is still not cleared.
Assuming if an Upmove has started and the bottom has been done it will still have to be tested again , so price will reverse at these resistance levels , atleast a sideways corrective move.
Another angle which I have looked at it is the Action Reaction theory basis.
The current set of warning lines for the pitchfork drawn from the start of the downtrend has been supporting and resisting price very well.Projecting an equal range movement of two warning line channels above the bottom, the 4900 zone is a possible resistance zone.
Another observation is after a long fall, price pulls back towards 50 sma , it moves to an almost equal move of price above it and then reverses.This could be for retesting the earlier bottom.


Daily chart

Drawn the regular Median Line / Pitchfork and the schiff median line /Pitchfork.The junction of the upsloping schiff median line parallel and the downsloping LMLH is an energy point to which price can be attracted ...(Resistance zone.). When price moves out of a channel support it will retest the channel line.This falls near 4920-4950 zone in the chart.

Friday, November 25, 2011

Thursday, November 24, 2011

24.11.2011 Thursday

Posted the intraday 5 min charts before and after charts in the previous Post.

Today's 60 min chart

Today's close is a positive sign for a ST low .But it's going to be sometime before the downtrend is halted as this upmove / corrective rally may extend till 4920 zone and once again a probable sell off is possible.
The downside levels at 4530 zone will be an area to be watched out till we make progress in the upmove.

24.11.2011_Thursday


Intraday
Trade Chart worked out a target with 5 min chart


5 Min Chart Update at EOD


Posting Intraday analysis with notes. Magenta PF was drawn based on the low pivot at approx 61.8% R of the previous swing.There was a breakout above the retracement leading to the UMLH with a swift rise .

Wednesday, November 23, 2011

23.11.2011_Wednesday


Looks like Nifty does not want to settle down still !!
Lower side the targets are 4530 zone at LMLH and correlates with the 1.236%R of the previous major Swing.
Lot of resistance levels uphill .Probability of Nifty attempting the lows is more due to the negative global cues. Crossing 4850 which is the recent minor swing high is important in the near term.Today's close also does not give any indication there is a slowdown of the fall.If there is a gap down again tommorrow , then 4720 becomes an important zone to cross after price finds support at lower levels.

Tuesday, November 22, 2011

22.11.2011_Tuesday

Price trying to bounce because of oversold state,but the 4765 low can be confirmed as a Swing low only when price closes above 4850, the recent minor swing high area.
Upper end immediate resistances are at 4900 to 4930 zone.
It's going to be a tough and slow attempt to climb again after the swift fall last week.
If price violates 4765 low, then the bounce possibility is negated and price will move south towards the brown Lower median parallel at approx 4600 zone.

21.11.2011_Monday


Bears still in control...

Price has now touched the Red Warning line below and the Blue warning line of the minor pitchfork.Chart is heavily oversold and ripe for a bounce in Stoch indicator.Whether it will happen tmorrow or before this week's settlement, will wait and see.

Friday, November 18, 2011

Thursday, November 17, 2011

Wednesday, November 16, 2011

Monday, November 14, 2011

Friday, November 11, 2011

Wednesday, November 9, 2011

9.11.2011_Wednesday


Price moved upto resistance and then into the support zone today and broke down the trendline / orange PF trigger line , below 5270-5250 negating any upmove for now.We have to watch out for the downside supports at 5200 and 5140 ( 38.2%R ) - 5120 zone (support at Red LMLH) .

Tuesday, November 8, 2011

8.11.2011_Tuesday


Price was perfectly supported at 5250 zone at the magenta and green LML parallel as expected and charted in 4.11.2011 chart.
Today's move after being supported well,moved up and broke the descending trendline resistance from 5381 level, and closed near the open level, a Doji bar.
Looking at the positive side, we have a double bottom at 5250 zone for an upmove to commence.
The path for the next two day's probable move - 5283-5270-5350-5320.
Stoploss trigger for long positions will be a strong break of 5250 .
Reverse bullish divergence seen in charts at 5200 levels and 5250 levels.
Stoch and RSI has a Bullish reverse divergence with the double bottom levels formed today and the double bottom at 5200 levels.

"Bullish reverse divergence" is when price is making a low and higher low whereas the corresponding level in the oscillator is making a low and lower low.It can signal that a sizeable swing in the direction of the stock's underlying trend is about to take place.In this case it's a double bottom and not a low and higher low, so will wait and watch how it turns out.

Friday, November 4, 2011

Thursday, November 3, 2011

Wednesday, November 2, 2011

Tuesday, November 1, 2011