Trading with Median lines is a system and a leading indicator suitable for Swing trading.I am following this strategy for Nifty and Bank Nifty with good results.Those interested to trade with Charts and Price action to analyse target price, support and resistance levels will find this strategy very interesting.

Feedback welcome!Happy trading...

Monday, November 29, 2010


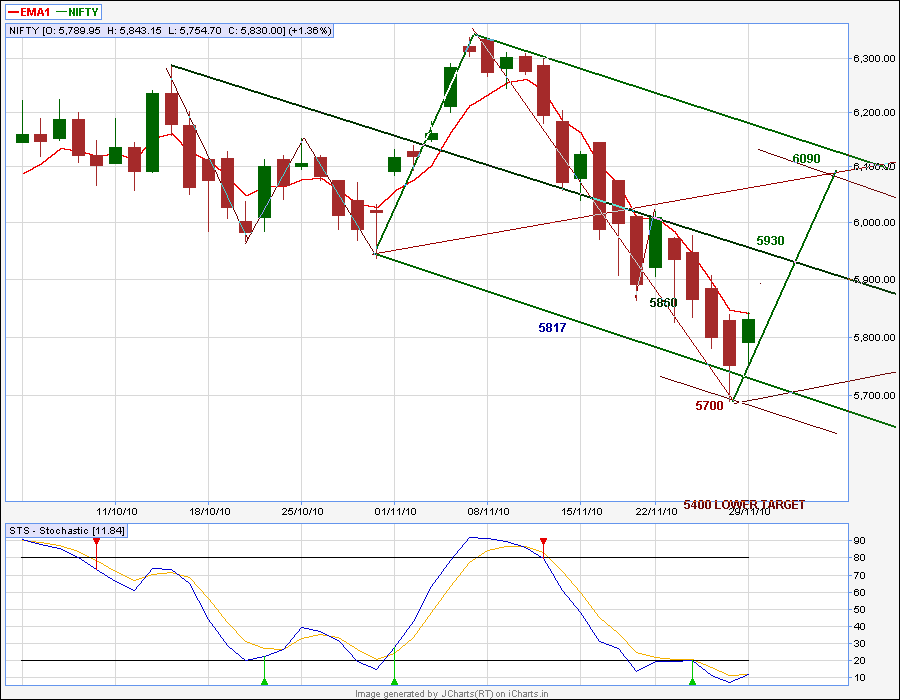
Nifty in short term pullback...

Nifty expecting it to pullback till 5930 / 6090 levels in the short term.My analysis is based on
- Stoch readings at oversold level in daily chart.
-Today positive move after the down wave touching the Lower median line parallel
The equal ( of previous up move ) and opposite move ( from current down wave ) projected from fridays low leads to 5930 / 6090 levels.This is the positive outlook.The outlook will be negated if the price falls below 5700 levels piercing below the Lower median line parallel of both green and red pitchforks
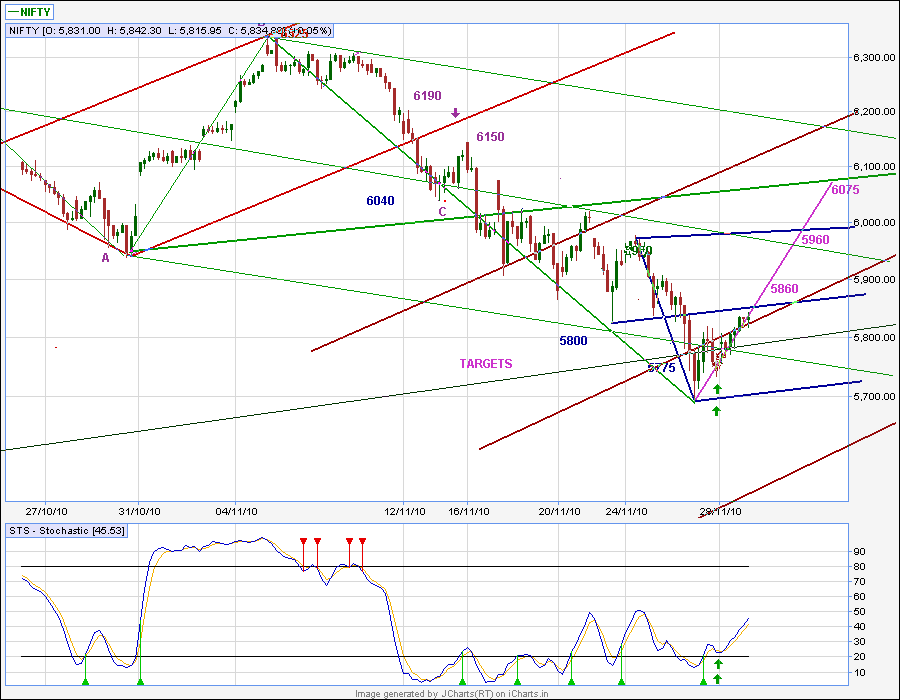
60 min chart

The price is very close to the Blue median line and expecting to meet resistance at 5860 levels.
As stoch readings are climbing up expect the prices to move upwards to wards 5930 - 5960 levels.Above 5960 ( where the prices will cross the Green down sloping major Median Line , 6075 -6090 levels should be reached faster as above 5930 Short term trend will be positive.
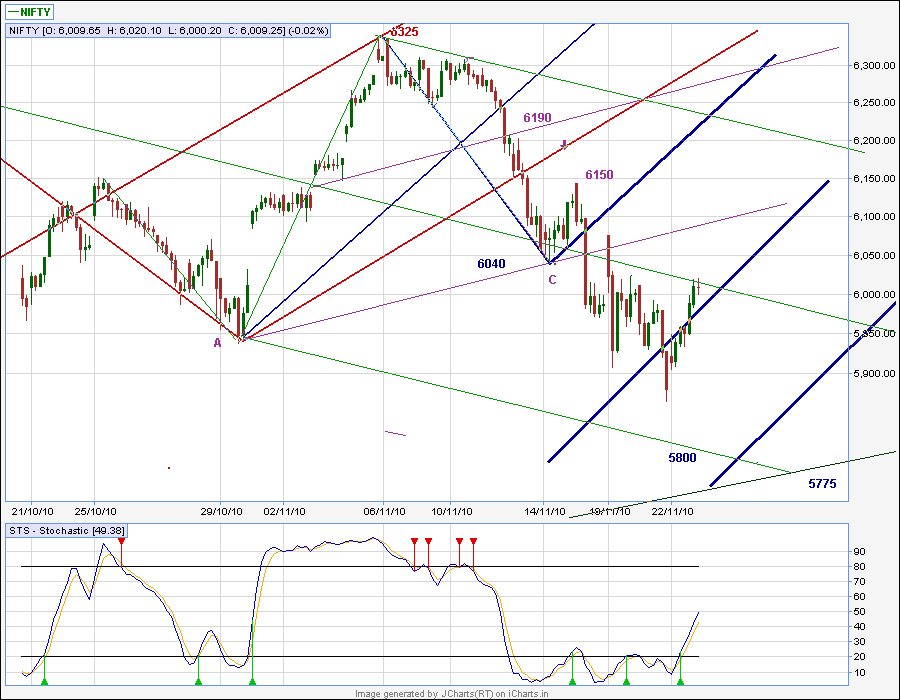
15 min chart

Todays price move was not in the same angle as the previous upmove and was more of a steady step up step down step up movement.
Price move will be upwards if sideways movement persists around median line levels which can acts as support and propel it towards 5930 . Stoploss for Long positions will be at 5800 / 5775 levels .


Thursday, November 25, 2010

Nifty still going down...

Daily Chart

Nifty crossed the major red Lower median line from 4807 to close at 5800 level.Projecting a minor pitchfork support levels look much lower at 5700 /5650 if it falls at the same pace after minor pullbacks during intraday .Stoch readings are oversold but only higher prices will make it turn upwards.

Hourly Chart
The prices have reached the bottom of the minor red descending pitchfork and may touch 5750 levels tommorrow and a pullback may commence towards the mini red median line and upper median line if the price moves are fast.Current wave high of 5980 levels should be overcome for positive cues to start.The junction of the ascending green pitchfork and descending red pitchfork is around 5930 levels which can be a resistance.Thats about 130 points from today's close and quite a distance to cover in a day unless the bulls take over aggressively.

15 min chart
Price has touched the bottom of Lower Median line of green Pitchfork.
5850 / 5900/5930 are probable resistances for a pullback from todays low , if it doesnt gap down from todays close.

Outlook:
The next prices expected are below at 5700 levels if Nifty can't climb above 5865 / 5900 levels .The game is to wait and watch.


Wednesday, November 24, 2010

Nifty ending the downmove


Nifty met the resistance at 5950 levels yesterday at the red ascending pitchfork.Today moving up further could not pass thro 5960 levels and came down further to reach the Lower median line pierced thro and closed at 5851.Expecting the price to halt at 5775 levels and REVERSE.
This is the confluence of longterm median line support and lower median line of the major pitchfork being followed during this downtrend.Looking out to close all shorts in the morning hours of 25.11.10.
24.11.10 15 min chart

60 min chart show divergences in stoch and prices which is indicating strength and possible end of downmove.

Daily chart The stoch readings are oversold and ready to turn up.

Outlook:

Confirmation of upward prices and strong moves tommorrow will turn the short term trend up.
Strong global moves in world markets at the time of this post is a positive sign.
Looking forward to a great day tommorrow :-)

Monday, November 22, 2010

Nifty pausing and seeking direction

The Nifty had a good pullback from 5900 to 6000 levels today. 6000 levels is the price where it touched the green median line which can be a probable resistance point. If it does not pierce thro tommorrow in the first one hour, expecting up down movement around these levels for some time.
60 min chart
15 min chart:Showing the descending magenta pitchfork and the breakout at 5875 levels.
15 min chart: With median lines showing probabilities of movement of nifty after breakout today.
If it closes above 6040-6050 levels tommorrow then target of 6155 / 6215 expected.

Outlook:
If unable to break above 6000 levels it can down below to 5960 then 5930 levels expected.
5930 should hold for further upmove to unfold.If at 5930 nifty goes up , probable head and shoulder pattern with breakout at 6020 level can be a possibility.

Below 5930 , the downward journey can resume for levels of 5870 / 5750 where the correction from 6325 levels should be put on hold.

Friday, November 19, 2010

Nifty falling down further...

The day was quite choppy one as the prices moved up and down during the mid morning session..When prices moved upwards after reaching 5930 levels ( without going down to 5900 as expected) , it was a feeling of apprehension that shorts not closed earlier at lower levels during the day were still open and whether they would turn out to be losing trade.But holding on to the belief in the system, that till 6025 levels were cleared ,i stayed put....After 2 hrs from 12.30 - 2.30 prices hovered above the pitchfork line and looked like it was going to break out above....
And what a surprise! prices fell thro so fast in the last hour it zoomed thro my target levels...reconfirming my belief in the median line .
Two days of a great trade with 450 points in 4 lots.
60 min chart-19.11.10
15 min chart:The prices stayed below the 50 sma and was a tough resistance.I keep drawing the mini median lines to judge whether they are breaking out.The red pitchfork was drawn to observe the prices moving in the upward direction.But the failure at the lower median line finally gave way to the great fall for today.The levels reached were the two parallel warning lines drawn with the 50 % range of the previous wave of the Pitchfork.Probability is very high that it can reach the 3rd parallel line at 5800 levels which correspond to our targets from the 60 min / daily charts.

Outlook for next week:
Can reach 5800 levels and make a reversal.Will head upwards to 6000 / 6150 levels.The previous wave support and resistance levels will be looked out for entering positions.
Weekly trend is down so it will be sell on rises.So short term long trades after daily chart stoch indicator turns up.

Thursday, November 18, 2010

Nifty is indecisive...

The choppy action today is not very convincing to me to confirm the end of the down move.

Daily chart :Todays price low reached the 50 % range between Median line and lower median line This level- 5907 was very close to the 5887 level expected.The swing low can be confirmed only after tomorrows price move.The STS indicator is still heading down and not reached oversold levels.Till then down trend holds.

60 min chart:
The price is still below the descending green pitchfork with resistance at 6025-6050 levels.
Drawing a blue minor pitchfork from previous wave pivot points,lot of up and down action near the median line is seen.
15 min chart:Prices are contained within the recent minor pitchfork descending down.The 50 sma / 100 sma are overlayed to verify trend .On prices moving above MA's , resistance and support levels 6150 and 6050 will have to be used to close short trade and initiate long trades on breakout above 6150 levels.


For 19.11.10 :Probability for reversal based on global cues will meet resistance at 6050 / 6150 levels.Will have to watch the action around these points.Will hold shorts till 6150 levels and go long above that range.


Wednesday, November 17, 2010

Study Resources for Median Line Trading

Andrews course on action reaction line trading

Tim Morge - a pioneer in this concept .His website is an excellent source of information for median line trading.Here is the link to a good collection of articles on his methods .

Monday, November 15, 2010


Nifty supported itself after falling through 6160 at 6060 levels at the green parallel line drawn parallel to the main median line from 5350.6060 was the 50 sma range also.The levels noted on 11.11.10 were held.
As the stoch indicator is falling , my view is the correction will continue till it reaches oversold levels.

Looking at the hourly chart,the price fell through the red pitchfork and was supported on the descending green pitchfork.This junction is the culmination of Warning line drawn from 5350.

Now if this point breaks expecting prices to move south to 5890 levels.This level is calculated with parallel sliding line ( distance 50 % of B- C range from point C).But the path whether it will be a sideways move or faster fall will have to wait and watch....

Current relief rally can be resisted at the red median line at around 6190 levels.At this junction the prices can reverse.So watching out for test and retest and price reversal at these levels.

If price moves upwards the next level would be at 6250 - 6235 which is the junction of upward red fork / blue fork and downward green fork.The schiff lines from AB also pass thro this point for added weightage.


Friday, November 12, 2010

5 min chart is showing consolidation for the past one hour.Double bottom formation and minor divergence in STS .
My fork from these pivots gives a small pullback upto 6150 .this is the previous low.whether it will be a resistance let me wait and see.

Continuing fall

Price has fallen thro the blue LML. It has touched the parallel reaction line also .Stoc still in oversold zone but no divergence yet.

Looking out for 6090 levels ( 61.8% R levels ) nearer to Green Median line.
Test and retest Of ML and movement upwards will confirm for the probability of reversal.

Thursday, November 11, 2010

Correction on 11.11.10


Price reached median line at 6325 range and started to reverse from 5.11.10.I charted the green pitchfork to watch how the scene unfolds.after meandering for 3 days , still within the green UML .another mini median line drawn in blue was done to establish the direction. probabilty for price to reach LML .Entered my shorts at 6309 NF on wednesday.EOD was undecided but the median lines were proved on Thursday.What a fall.The price hit the LML of mini fork exactly at fib retracement.

Will be looking out for price to reach LML of red fork / further down to the green fork.before reaching down the price can retest the blue median line.If so on test and failure will add one short position.
A divergence in the STS indicator will be watched out to close my shorts and reverse position.

I wish to thank Ilango sir from Just Nifty blog in using the SToch indicator with 35,3,3, settings which is proving to be an excellent lead indicator for my analysis.I'm using it to identifying the pivot points for drawing the median line .

Thursday, November 4, 2010

hour and 5 min charts with median lines


Hour chart with previous swing highs marked for projecting resistance levels


5 min chart.schiff lines from previous waves are marked in green.My pivots are marked as A,B,C,D,E.schiff line from AB gave the target at D.
Current Median line is drawn from B through CD .At median line price has zoomed thro and the target is now the Upper median line.Levels at range of 6325 .this is fib proj levels of prev wave also.

Will close my positions taken at 6147 - NF and wait to see the action around UML and any pull back to median line.


Daily chart - short term

Daily chart with median line and schiff lines Starting Pivot at 5348
Schiff lines and long term median line confluence at 6300 - 6350 range.The test of this line will decide whether it will act as a reistance.
Went long at 6147 NF on 2.11.10 near Upper median line of previous correction.


My charts with median lines for daily, hourly and 5 min charts

Long term median line from 4681 in feb 2010.Prices moving up within ML and Lower median line.