Monday's action must have been a rude shock to traders due to the sudden down spike in the morning.My long posittions were closed at stop loss levels near the lows of the day by just a few points!!And was amazed at the reversal above 5840 levels.As was not accessible could not enter again at lower levels so kept myself out of this swing.
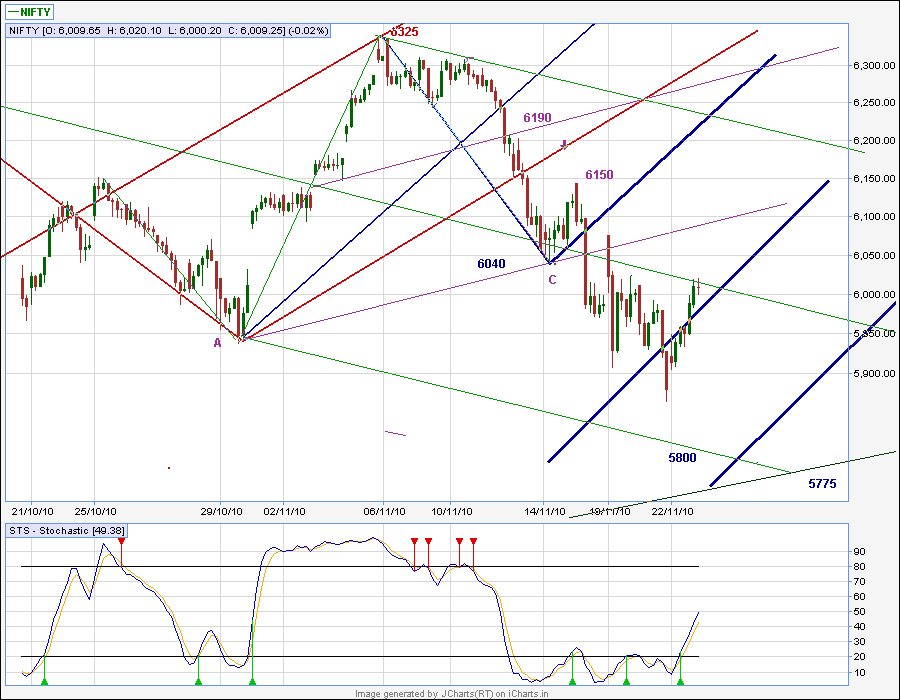
15 min chart
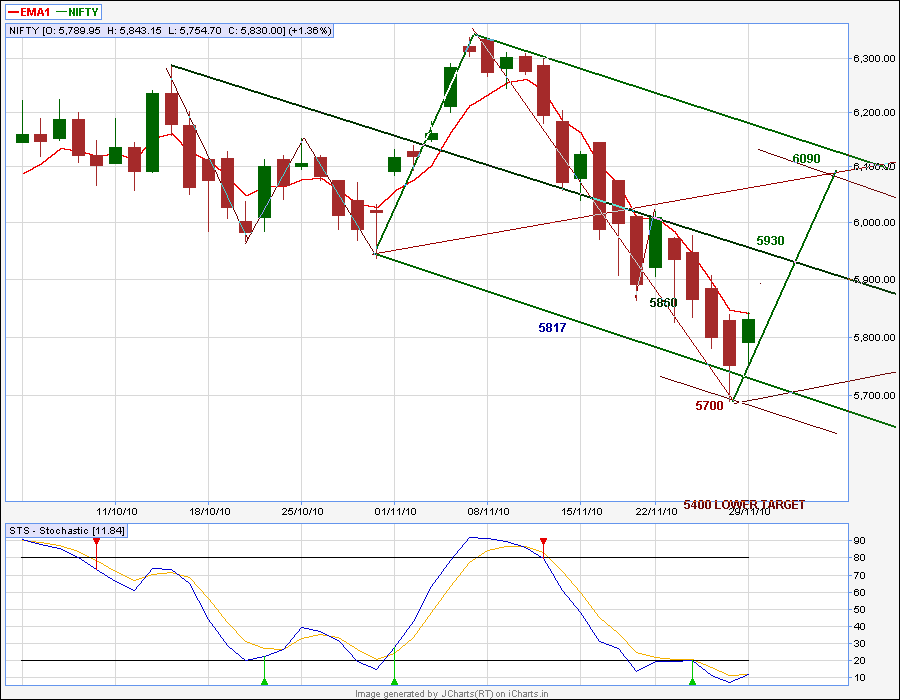
 60 min chart
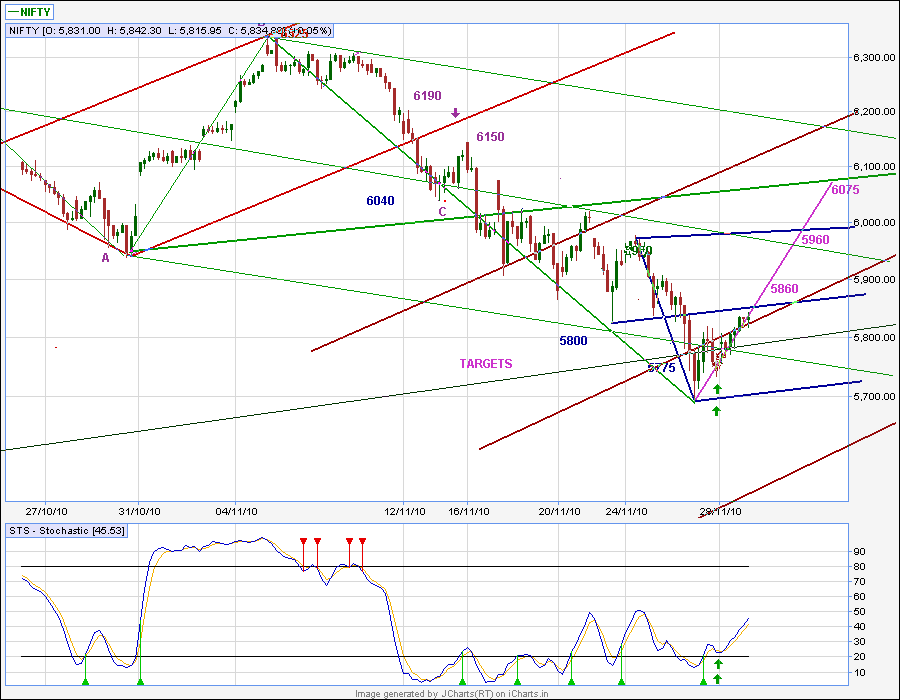
Was looking out for the resistance level to short which happened today.Though the upper levels expected were above at 5967 / 6000 levels , following observation made me enter the short trade:
1.Closed lower at first target of 5930 - 5950 below 50 sma.
2.The swing has met the Schiff median line and reversed .
3.Price not reaching median line ( in blue) and reversing today gives a projection of lower targets equal to previous swing.
4.Stoch indicator has given sell signal in 60 min chart which I follow.
Targets for this swing - 5780 -5760 levels and further down to 5720 ( prev swing low ) 5605 ( equal to prev down swing from 6068 -5721).
EW outlook: I don't track the waves long or medium term with EW rules but study the wave patterns within the swings only - 6069 - 5721 is an impulsive wave , 5721 to 5954 - abc reaction wave , next wave could be an impulsive wave.
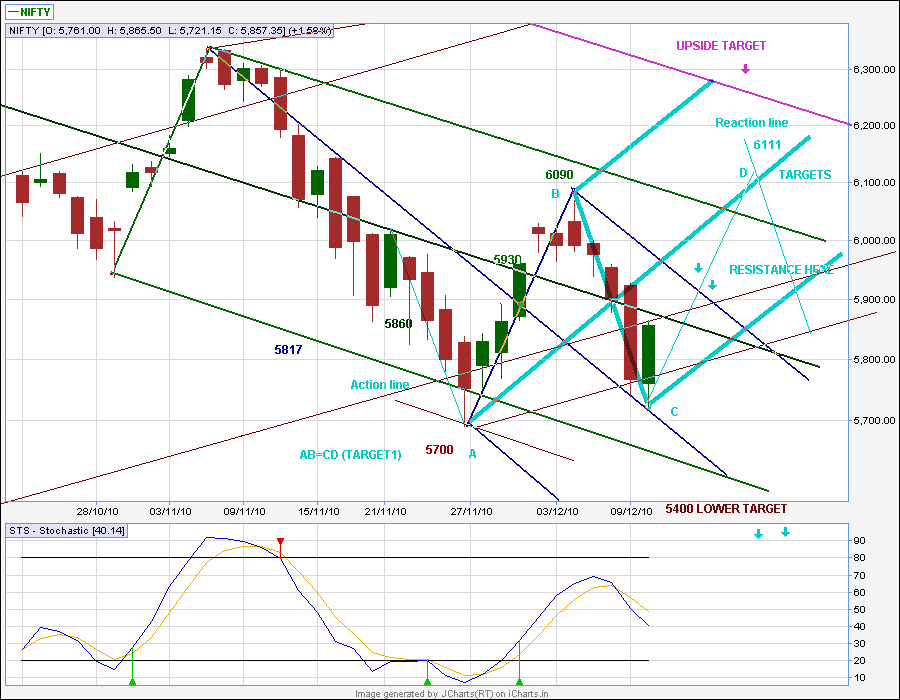
Daily Chart 15.12.10

What if?
If todays action was just a reaction wave and swing continues its upward move by crossing 5950 levels then the original target of 6100 levels should hold.


