http://www.4shared.com/photo/S2ArgUjo/March_series.html
A compilation of march charts in one image.
Can scroll and see the charts continuously.
Friday, March 30, 2012

Thursday, March 29, 2012

Wednesday, March 28, 2012

Tuesday, March 27, 2012

Monday, March 26, 2012

Friday, March 23, 2012

Thursday, March 22, 2012

Wednesday, March 21, 2012

Tuesday, March 20, 2012

Monday, March 19, 2012

Sunday, March 18, 2012
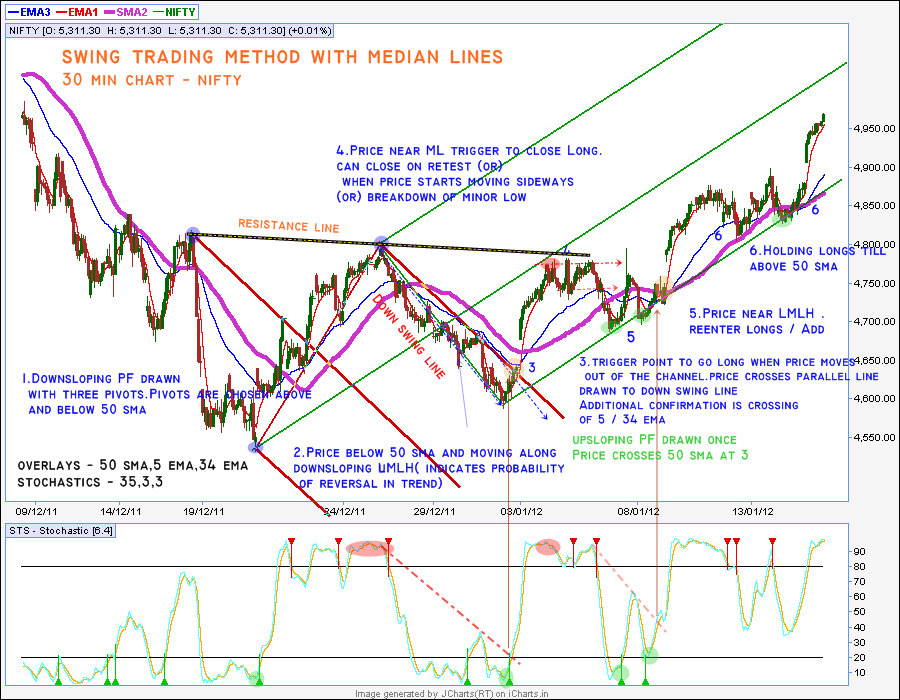
Median Line Swing Trading Method 1
This method uses combination of Median lines, Trendlines , Moving averages and Stochastics technical indicator to identify entry and exits. This is a discretionary method following the guidelines in which the tools can be used.
Aim: To capture the maximum run of a price swing between support zone and resistance zone.
Timeframe: 60 min(or) 30 min chart for positional trades
15 min (or) 5 min chart for intraday trades
Tools:
1.Median Line set
2.Trendlines – Horizontal support and resistance lines, Downsloping and Upsloping resistance and support lines
3.Moving Averages : 5 EMA, 34 EMA,50 SMA
4.Stochastic indicator with 35,3,3 settings
Explanation and role of tools in the method
Median Line Set comprises of a median line ( ML) and two parallel lines to it called as Upper median line parallel ( UMLH) and Lower median line parallel ( LMLH).In a price chart, three pivots are chosen where a significant reversal in price has been completed. If the three pivots are termed as 1,2,and 3, the median line is drawn from pivot 1 through the midpoint of a line connecting pivot 2 and 3,and two parallel lines are drawn from Pivot 2 and Pivot 3 parallel to the median line. This the Median line Set.
The Median line (ML) is termed as a Magnet line which attracts price towards it.The UMLH is a resistance line and the LMLH is a support line. Similar to properties of horizontal support / resistances, these lines act as boundaries where the price move runs out of energy in the channel and a price reversal is expected to occur.


Trigger lines :When a line extends from pivot 1 through point 2 / pivot 1 through pivot 3, these lines are termed triggerlines. Trigger lines define a boundary which when violated indicates a reversal / change in momentum of price movement.
Warning lines: When a line is drawn parallel to the UMLH AND LMLH at a distance equal to 50% range of range between pivot 2 and 3, it is termed as a warning line. Equidistant Warning lines are drawn parallel to the UMLH and LMLH when price moves out of the Pitchfork/ median line set. The nature of the warning lines are the same as the UMLH/ LMLH in its support and resistance properties.

Trendlines
A horizontal line which connects previous pivots where price has reversed, can give support / resistance when price approaches / meets it.
A sloping line connecting a series of lows / highs is expected to give support and resistance when price approaches / meets it.
Support lines can become resistance lines when price moves down the support line and then climbs up retests the support zone and vice versa.
Cluster of prices at a certain level also act as supports / resistances.
When price breaks out of a trendline, it is an indication of change in behavior and reversal in trend. When a breakout occurs, price reverses and tends to retest the breakout level. If price retests and moves higher then the retest is a success and price will reverse direction.

Moving Averages
50 SMA is used as an overlay to define the trend and maintain the position entered for a maximum time till it reverses conclusively.
5EMA / 34 EMA crossovers are used to finetune entries and exits at the turning points .
Stochastics ( 35,3,3)
Momentum indicator used to identify overbought / oversold zones.
Both Moving Averages and Stochastics follow price and will be a lagging indicator. The method uses the these indicators to identify the general trend and to estimate when price is approaching overbought and oversold zones with relation to the previous swing.The confluence of these with median lines define high probability entry / exit points .
Median Line Trading Guidelines
Dr.Andrew’s Rules for the Pitchfork is that when trend is intact, price will gravitate towards the median line 80 % of the time. Price will react to the median line in 3 ways
1.It will be resisted and a price reversal / pullback can immediately occur.
2.It will zoom through the ML, towards the UMLH and vice versa
3.It will consolidate at the ML zone /move in a range before a breakout in either direction.
Once a long or short is entered ,if price does not stall at the median line , it will tend to move upwards towards the UMLH for a long position and towards the LMLH for a short position
When price reaches the UMLH - Upper median line from below, book profits for buy trades or enter a short position.
When price reaches the LMLH - Lower median line from above , book profits for short trades , buy the market or enter a long position.
If price bar action shows clues of resistance / support at the ML - median line , then short / long positions can be entered and price move will be expected towards the LMLH / UMLH.
Price moves within the channel will meet resistance and support at horizontal / sloping support / resistance lines. Minor ML sets can be drawn to estimate the smaller price moves.
Targets
Once position entry is decided, targets are identified at
1. Immediate Minor Swing high / Minor swing low above / below the price.
2. 50 % of range between pivot 2 and 3.
3. Price meeting median line. This point can be calculated by drawing a line from pivot 3 with a slope same as the previous swing in the direction in which the new trade is being entered.(Note:This is an approximate estimate of the move,and price may not necessarily move in a straight line. The move will be expected to move in an up / down / sideways sequence as and when it meets intermediate downsloping / upsloping resistance / support lines. The targets can extend further down / up when it starts moving sideways range and then breaks out.)
4. If price moves / zooms through the ML, then the targets are extended towards the UMLH/ LMLH for an upmove / downmove.
Stops
The UMLH and LMLH are the boundaries of the expected price move. So the levels at these lines act as stops to positions entered close to them. The exact levels can also be identified above minor swing lows / highs or at horizontal support / resistance lines from previous price pivots.
The trade is managed with having a trailing stoploss below recent minor lows / minor highs in a upmove/ downmove.
Risk reward ratio
The ideal RR ratio should be a minimum of 1: 3,but as it’s a discretionary system, the trader can define the money management rules as per account size.
Adding to original position and part booking of position
The decision to add / part book positions is as per traders style.
Aggressive style – when one enters the full position in one point and Conservative style – when entering in stages. This also depends on the time period which one wants to hold the trade and the risk planned. Longer holding period will have pullbacks when the profit curve may move up and down on the position and the trader’s mindset should be prepared it.
The full position can be entered in the initial entry point and part booking at target levels with trailing stoploss for balance.
Adding to positions can be done when price breaksout of a minor swing high / low.
The Setup of the Chart
1.The 60 min chart is displayed.
(For intraday trades 5 min charts can be used , but entering trades with the trend will be ideal to catch the longer swings and avoiding whipsaws in the shorter timeframe.)
2.Overlay of 50 SMA is done. 5/ 34 EMA optional.
3.Stochastics indicator with 35,3,3, settings is used.
The Method
Marking the Swings
Mark the pivot highs and lows of swings. This can be visually picked out from the chart as the highest point when price is above 50 SMA and the lowest point when price is below 50 SMA. Connect the series of minor swings above and below the 50 SMA.A series of higher highs and higher lows is an uptrend and vice versa.
The trend is identified.
A major median line set ( also called as Pitchfork) is drawn with the major swings in line with the trend. If the pivots are Low, High, Higher low, the Pitchfork will be an upsloping Pitchfork and vice versa. So if the series of swings point to a downtrend, a downsloping pitchfork is drawn and if in an uptrend , an upsloping Pitchfork is drawn with suitable pivots. We’ll call this the Trend pitchfork.
If the Median line channel is too wide , then smaller swings are used to draw consecutive Pitchforks to follow the price moves. The Pitchfork with the recent pivots will be the called the Current Pitchfork
Where is the price ?
Where is the position of the price bar ?If above 50 SMA, then it is already in an uptrend / upswing and vice versa.
The aim of the strategy is to identify the turning point of a swing from where a price reversal can take place. We have to catch the lowest point when it is below 50 SMA to ride an uptrend and vice versa .Entry level with a minimum stoploss point is the goal .
So if the price is below 50 SMA , the lookout is for a support level to enter a long position. Draw a downsloping Pitchfork with recent pivots.The high probability entry trigger zone will be a confluence of
1.The price meeting / near the median line
2.The stochastics in oversold zone.
3.Candlestick reversal formations like hammer, bullish engulfing etc can be used for confirmation for entry zone.
When to enter?
Draw a downsloping trendline from the pivot high of the developing current swing to the temporary low point ( named as temporary as it is not yet confirmed as low).Identify a minor pullback completed earlier in the current swing and draw a parallel to the downsloping trendline through the swing high of the pullback. After price crosses this parallel line, enter a long position on the first retracement . A 5/34 EMA crossover can be used as additional confirmation. Stoploss will be the recent swing low from where the price has reversed.
Once price moves above 50 SMA, the temporary low is confirmed as a swing low, and a new upsloping Pitchfork can be drawn. The position is managed as it moves within this new pitchfork.
Exits
Targets as mentioned earlier. These points can be used to part book profits.
Position will be held till price is within trend.ie Longs are held till price is above 50 SMA and shorts are held till below 50 SMA.
Aggressive style trading - Positions can be part booked at intermediate targets / at UMLH,LMLH,ML’s / at resistance lines / support lines and rentered on pullbacks.
Example Chart
Friday, March 16, 2012


Thursday, March 15, 2012

Wednesday, March 14, 2012

Tuesday, March 13, 2012

Monday, March 12, 2012

Friday, March 9, 2012

Wednesday, March 7, 2012

Tuesday, March 6, 2012

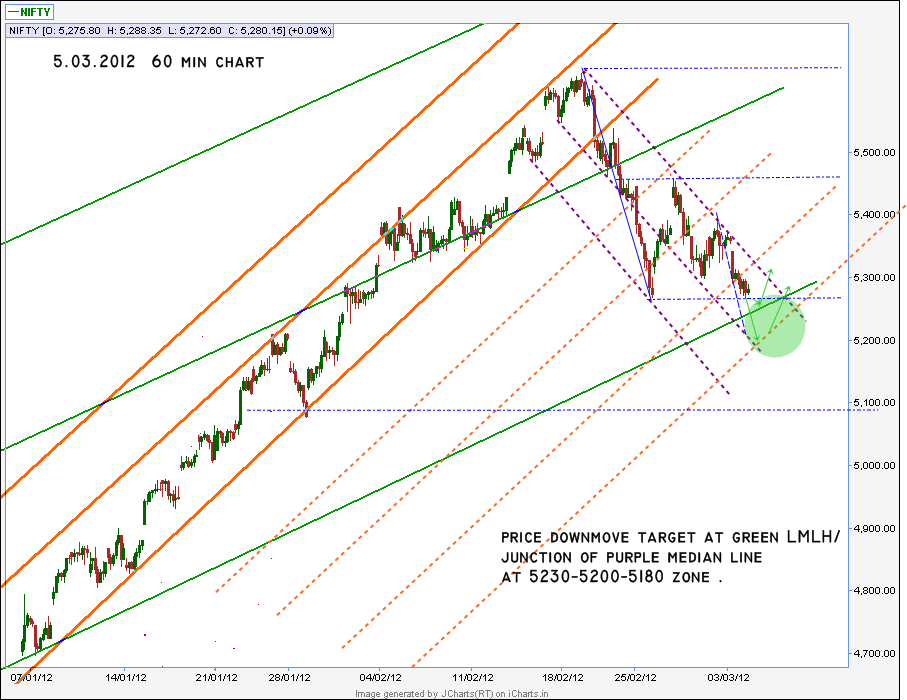
Monday, March 5, 2012
Friday, March 2, 2012

Thursday, March 1, 2012

Subscribe to:
Comments (Atom)