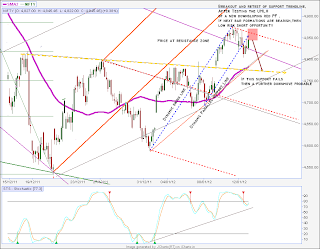
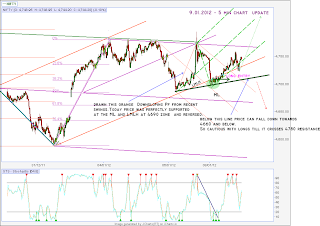
Trading with Median lines is a system and a leading indicator suitable for Swing trading.I am following this strategy for Nifty and Bank Nifty with good results.Those interested to trade with Charts and Price action to analyse target price, support and resistance levels will find this strategy very interesting.
Feedback welcome!Happy trading...
Tuesday, January 31, 2012
31.12.2011 Tuesday
Posting an EOD 5 min chart with notes on my thought process intraday on seeing the price moves and the result....
60 min Chart
Monday, January 30, 2012
Friday, January 27, 2012
27.01.2012_ Friday
Posting a compilation of my 60 min charts of Jan 2012.It can be viewed by scrolling in windows picture viewer.
Hope it will help those interested in the ML method.
http://www.4shared.com/photo/0gTGBvT...n_charts1.html
60 min chart
Hope it will help those interested in the ML method.
http://www.4shared.com/photo/0gTGBvT...n_charts1.html
60 min chart
Wednesday, January 25, 2012
25.01.2012 Wednesday
Tuesday, January 24, 2012
24.01.2012 Tuesday
If Price hits the 5180-5200 zone, it would be another example of the magic of median lines :).
Expecting price to hit 5180 and then profit booking to start which may drag price down to 5080-5085 levels at the LMLH support.If volatile on the expiry day then we can expect this to be the series close.
Price still is in an uptrend till we get a signal of price crossing previous swing lows at 5000-5020 band.Then we look out for retracement ot test the highs.If price moves in a range within 5200-5100 then we can aim for higher targets.The game would be to watch how the price reacts at the current resistance zone.
Monday, January 23, 2012
23.01.2012 Monday
Still in indecision zone.Is Nifty waiting for one more batch of buyers to push it to the top or will it back out in its rally tommorrow.No clue as per charts but very close to the initial testing of the breakdown point from the Green LMLH.Looks like there may be another day of testing the support levels.Longer it takes, the upward move prospects will be brighter rather than the correction to the current rally.
Daily chart analysis
Friday, January 20, 2012
20.01.2012 _Friday
Thursday, January 19, 2012
19.01.2011_Thursday
Price is not relenting in its race to reach greater tops.Defying the expectation of many that the top has been reached at 4900 zone , it did not wait to rush upwards.
I've marked the series of swing highs and lows and the pattern is clear with higher highs and higher lows.No signs of slowing.Today was a gap day and consolidation and close at high area.Positive view is that nifty looks to be set to reach the orange median line at approx 5100 zone if it moves with the same momentum without a sideway's range. And if so , andrew's rule will be proved once again.( Andrew's rule states that price will meet the Median line 80% of the time)
Downside, Retracements to fill the gap and at support exists at 4930 level is a possibility due to profit booking.The clue to a reversal in trend can only be when price closes below 4930.Till then with price within the lower channel of the orange pitchfork , the uptrend is in force.
The gap up on 17th and 19th would not have allowed many to climb onto the rally ,as looking around ,majority opinion was a fall from 4900 zone ( including me , closed all positions at that level)Long term positional traders would have gained if they had sat tight.:)
Current market moves do not give a good location to enter positional trades on both sides.Long trades RR ratio is not good and for shorts the bearish patterns / a fall below swing lows are yet to happen.So waiting at the sidelines for a suitable entry.Till then Bulls are the winners.....
Wednesday, January 18, 2012
Tuesday, January 17, 2012
17.01.2012
60 MIN CHART
On Monday price was still at a critical area where bulls and bears were fighting it out .The close was positive and it emerged that the bulls had an upper hand when the price was pushed from the early morning lows to close at the day's high zone.Still the outcome could have been either way and the bulls won today with the breakout above the resistance area.What a breakout rally!
The morning's breakout and WRB hour bar set the rally rolling and it looks poised to move towards a target of 5000 zone at the green UMLH.We have a strong support zone at 4925 area for any retracements which may be triggered due to any negative global cues / or profit booking.
The uptrend holds till it moves within the upsloping major orange PF.
Friday, January 13, 2012
13.01.2011 Friday
Price did finally break out of the resistance at 4880 to reach 4900 zone and closed positive for the day.The zone is still an indecision zone if we go by PF analysis.
Positive view-
Price above 50 SMA inside ascending main PF. ..still in uptrend
Broken out of the temp PF so the upmove may continue. within the new channel created.
4800 zone is the support level for the upmove.
Negative view - It's touched the trigger line and yet to cross it with momentum.Still in resistance zone.Looking at stoch indicator (35,3,3 ) , there is a probable divergence which indicates a top being formed...
The finale should unfold with monday's action.
Reduced 30 % of my shorts and balance hedged with calls,so will be taking a call on monday.
have a nice weekend..
Thursday, January 12, 2012
12.01.2012 _Thursday
Intraday 5 min chart
EOD 5 min chart and projections for next day
60 min chart
War continues even more fiercely!!A gap down , pullback, massive fall and then again retracing more than 60 % R of the day's range from low..Phew!!
The initial entry point with the SL point would have been triggered but the next test of the same high zone was a good area to short and it fell right down to the projected target zone.
My trades
( I'm carrying the shorts taken yesterday with the SL of 4900...)
I had placed a target order for one lot at NF 4830 it was filled.Holding the balance for tommorrow for target NS 4780 and may add to position if price reaches entry zone.
Wednesday, January 11, 2012
11.01.2012 Wednesday
A dull day with range bound movement . As expected a mild tug of war between bulls and bears trying to test each other's support and resistance levels.
Earlier in the morning the 5 min chart indicated a double top where I entered a Short for intraday.
Price moved further sideways out of the blue Median line channel .The breakdown did not happen .Instead price went up further , tested the LMLH and reversed down again.The mood is of indecision on both sides I presume - bears want to go down but bulls are still gunning for an upmove till 4900 .We'll know which side wins tommorrow.
My bias is a retracement towards 4830-4800 level before the next upmove.This corresponds to Fib R % levels 4835 - 4807 ( 23.6 % and 38.2 % R of low on 8th january to today's high.
So holding shorts also for short term to manage the retracement.
5 min chart
60 min chart
Tuesday, January 10, 2012
10.01.2012 _Tuesday
Monday, January 9, 2012
9.01.2012 Monday
5 min chart update
60 min chart
The price fell swiftly towards the LMLH zone, crossed it and reached 4690 area.Drawing a downsloping Pitchfork from the minor swing pivots, noticed the price halted exactly near the ML.As per plan entered long , but at a lower level .
The day's action seems to be a steady rise towards the earlier resistance zone.Only point of concern is the steady intra day rise may indicate caution as it has been moving along the LMLH,and would have been happy if the rise had been more faster with momentum and closed higher today.Instead the price is still stuck in the range and we'll have to wait with caution for the next move.
Sunday, January 8, 2012
WEEKLY TRADE PLAN
Friday, January 6, 2012
6.01.2012_Friday
Price gapped down to test the support zone at LMLH ,and zoomed upto the resistance line at 4780 zone.It has reversed from 50 SMA giving a positive sign for the upmove to continue.
Current Swing Targets at 4850 - 4900 zone where there is a confluence of
1.Major Red median line resistance and minor green median line resistance
2.Downsloping resitance trendline
3.61.8% R for previous swing
Thursday, January 5, 2012
5.01.2012_Thursday
Nifty playing hide and seek today:)).Moving up towards resistance of range made yesterday, giving hope of a breakout and reversing down.Tested the low of the range enticing a breakdown ..last hour bar a green bar and the day ends with no conclusion of its mood.
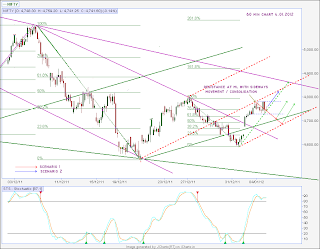
So , the resistance at 4780 line is still holding on , but no clue of a larger retracement as 4730 was also supported today.Longer it stays in the range, then upmove is expected.
Drawing a temp red PF to assess the swing,the momentum to fall was not there when it tested the UMLH.Instead it moved out of the UMLH .Tommorrow should be a decision day to move up or down and the ST trend will be more clear.
As of now, my ST bias is moving up north towards 4800-4850.
Wednesday, January 4, 2012
4.01.2012_Wednesday
Price met with resistance at the Median line at 4785 zone .Today's move was more of a consolidation day in a wider range after the huge rally.The range formed today is between 4780-4730 zone which is what we'll have to watch out tommorrow.
Two scenarios are probable
Scenario 1 ( marked in red and green arrows) - price moves further down towards the Green and red LMLH at around 4700-4690 zone, takes support and gears up for an upmove towards 50-4885 target.
Scenario 2 ( marked in blue arrow)- The momentum continues upwards.This will lead to resistance again at 4800-4840 zone where earlier we have many swing tops.The effect would be some minor retracement befor climbing up again.
Both the scenarios will get negated if we fall below the red lower channel at 4690 zone.
Tuesday, January 3, 2012
Monday, January 2, 2012
2.01.2012_Monday
Down trend still continuing...
Red PF is the major PF defining the trend and containing the downtrend till now.The price was supported at 4530 at the ML and has made a retracement , tested the Upper red ML parallel at 4800.The current move is again towards south .
Drawn a green Upsloping PF to estimate the support level for the downmove.The area marked in yellow would have been a good support area for an upmove to start, but price has moved further.
Drawing the dynamic Swing line from 4800 to latest low , with a parallel line through the previous minor swing high, today the price has moved past the Dynamic resistance line.The slope of the current Swing indicates the slowing down of the momentum ( price bars reached 76.4%R of the previous swing and are moving more along the UMLH and away from the ML) , with price probably trying to build a base / double bottom for an upmove.With the current position in the chart, price can move upto 4690 zone.From there two probable outcomes
1.Price moves towards 4800
2.Price is resisted at red UMLH at 4690 zone and moves down towards earlier low at 4530 and further below to retest the downsloping support line projected from earlier Lows.
Subscribe to:
Posts (Atom)