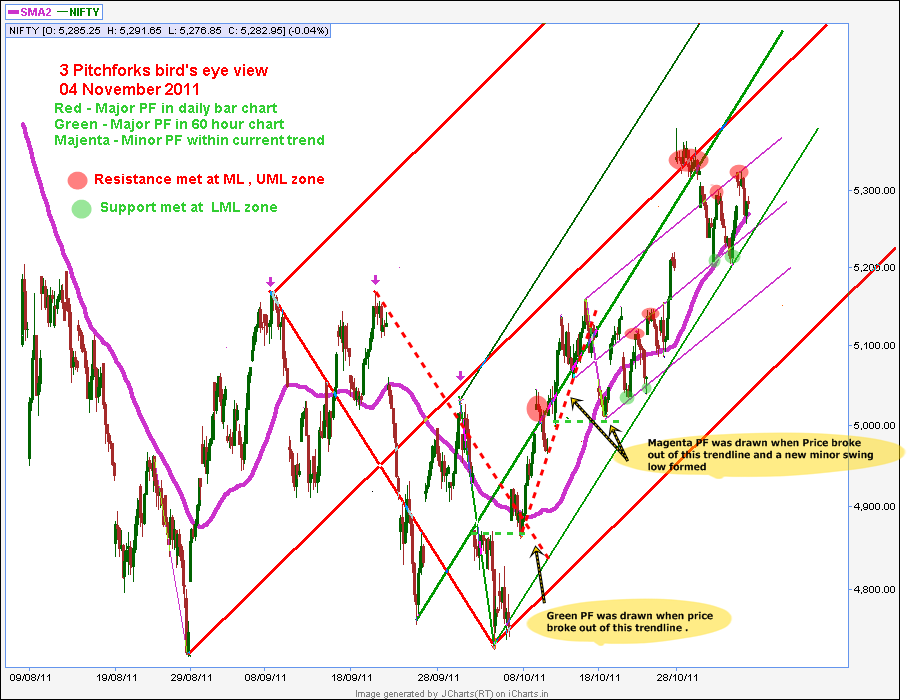
Price was perfectly supported at 5250 zone at the magenta and green LML parallel as expected and charted in 4.11.2011 chart.
Today's move after being supported well,moved up and broke the descending trendline resistance from 5381 level, and closed near the open level, a Doji bar.
Looking at the positive side, we have a double bottom at 5250 zone for an upmove to commence.
The path for the next two day's probable move - 5283-5270-5350-5320.
Stoploss trigger for long positions will be a strong break of 5250 .

Reverse bullish divergence seen in charts at 5200 levels and 5250 levels.
Stoch and RSI has a Bullish reverse divergence with the double bottom levels formed today and the double bottom at 5200 levels.

"Bullish reverse divergence" is when price is making a low and higher low whereas the corresponding level in the oscillator is making a low and lower low.It can signal that a sizeable swing in the direction of the stock's underlying trend is about to take place.In this case it's a double bottom and not a low and higher low, so will wait and watch how it turns out.


 Reverse bullish divergence seen in charts at 5200 levels and 5250 levels.