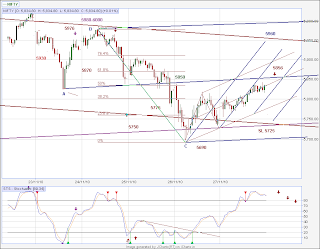
Nifty in short term pullback...
Nifty expecting it to pullback till 5930 / 6090 levels in the short term.My analysis is based on
- Stoch readings at oversold level in daily chart.
-Today positive move after the down wave touching the Lower median line parallel
The equal ( of previous up move ) and opposite move ( from current down wave ) projected from fridays low leads to 5930 / 6090 levels.This is the positive outlook.The outlook will be negated if the price falls below 5700 levels piercing below the Lower median line parallel of both green and red pitchforks

60 min chart
The price is very close to the Blue median line and expecting to meet resistance at 5860 levels.
As stoch readings are climbing up expect the prices to move upwards to wards 5930 - 5960 levels.Above 5960 ( where the prices will cross the Green down sloping major Median Line , 6075 -6090 levels should be reached faster as above 5930 Short term trend will be positive.

15 min chart
Todays price move was not in the same angle as the previous upmove and was more of a steady step up step down step up movement.
Price move will be upwards if sideways movement persists around median line levels which can acts as support and propel it towards 5930 . Stoploss for Long positions will be at 5800 / 5775 levels .

No comments:
Post a Comment