Daily Chart 27.12.10
 Nifty made a higher high today but closed below yesterday's close.The direction of Nifty is still without much clues and the plan will be to be prepared for whichever direction it moves.
Looking at the daily chart, Price has held on to the LMLH , within the lower channel.A break of this line can lead to lower prices in a sideways range for the next few days.Low of friday at 5940 levels should be a good support for any down moves.
15 min chart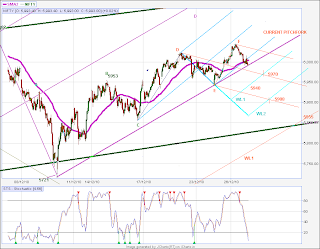 Looking at the 15 min chart, Blue pitchfork with pivots at C ,D,E was drawn to analyse the price movement.Todays high did not touch the ML of this blue PF and a down swing towards LMLH till close of the day.The price has touched and crossed the LMLH.
15 min chart
 Looking at the 15 min chart, Blue pitchfork with pivots at C ,D,E was drawn to analyse the price movement.Todays high did not touch the ML of this blue PF and a down swing towards LMLH till close of the day.The price has touched and crossed the LMLH.
Projected the WL1 and WL2 ( Reaction lines ) for targets for the down move.
Projected the Orange PF with pivots D,E,F ( Today's high) to chart the current price movement.Targets of 5970-5960,5940 ( earlier low),5908 are projected from confluence of PF and Warning Lines.
Outook for 28.12.2010:
Above todays high 6045 - Positive moves expected , with strong close Long position can be taken.
Resistance at 6030 and breakout below 5980 will lead to lower targets projected in 15 min chart ie 5960 / 5940/5908.
Till 5850 levels the moves can be categorised as corrective and below 5850 the trend becomes negative again.
Hi Kavima,
ReplyDeleteI think after the expiry (Dec) Nifty will move up.
Regards,
Veer