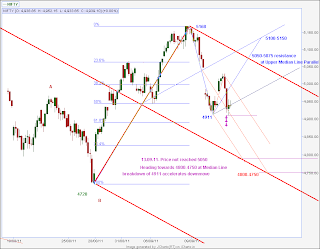
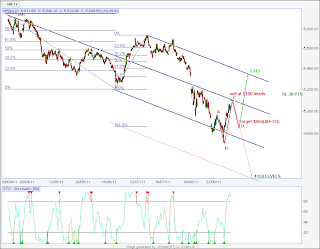
Price opened lower than yesterday's close,tested the previous high near to 5033 levels and then dropped down to close at 4940, close to our expected levels.As of now, the price is within supporting levels of a trendline channel shown in blue and the triggerline drawn from schiff median line starting pivot (50 % of previous swing.)
So the options of the swing move look 30:70 now for a move up / down.
My reasons for the possible move up are
Price moves indicate the tussle between bulls and bears for the past two-three days.The previous minor swing high has been crossed and the pullback was supported at his level.ie resistance becomes support.Today the low is still higher than yesterday's low.The prices seem to have completed a correction with an ABC pattern within a trendline channel.( though still today's low bar is not confirmed as the swing low.we'll wait to see monday's action)
IF the prices hold at this level, then the move can happen upward.But price has to be really strong as the climb beyond the resistance at 5033 is more than the down side support breakdown level at 4930.( 5033-4940=93 points against 4940-4930=10 points).The global cues are also so negative the negative outlook has more probability.
Price is exactly near the middle of the range of the past one month and it is going to be tough call for trade decision on Monday till the trend emerges.
Trading with Median lines is a system and a leading indicator suitable for Swing trading.I am following this strategy for Nifty and Bank Nifty with good results.Those interested to trade with Charts and Price action to analyse target price, support and resistance levels will find this strategy very interesting.
Feedback welcome!Happy trading...
Friday, September 30, 2011
Thursday, September 29, 2011
29.09.2011_Thursday
Price made an early low and climbed upto the zone till 5035 where I expected the resistance ie the point where the Upward Green Median line and downward red Upper median line intersects.
The pullback was contained within 38.2 %R of the previous swing and today making a higher high than the prev high, makes me consider the probability of an upmove developing.,The swing is heading towards prev high at 5150 zone , either immediately or with another pullback to 4987-4942 support .If it stops at 4987 and move north its going to be a swift move.Or else 1-2 days of consolidation till 4942 levels and move up.Below 4942 however this view gets negated and we're in for the move down.
Plan would be to look for support pattern at 4987-4942 zone to buy for target of 5150 zone. with stoploss of 25-30 pts.Below 4906 , price should go below the previous low of 4759.
Wednesday, September 28, 2011
28.09.2011_Wednesday
Minor pullback from Median line.The 5000-5030 range is going to be major test , as to whether nifty will breakdown or move northwards.As we have made a higher Low , the upward move is also a probability if it crosses 5030.There should be some consolidation with some zig zag movements around the Longterm downsloping Pitchfork .( shown in earlier chart)
Median Lines Method(contd)
Foundation of the Median line - 50 % ratio
50 % Ratio indicates the strength of a developing swing / trend and is an important level to use in trading.We calculate the 50 % levels of Year H-L prices,Month H-L prices,Week H-L prices and use them to outline the market's strength when below or above the 50% level.For trading using swing H-L prices and calculating 50 % level, we can assume the trend is down when prices are below and up when prices are above.
The System or Method
Median Line method can be a stand alone system with some simple rules similar to the concept of using trendlines.Like in trendline channels, this is also a trend identification channel , but gives a higher probability of the points where the price can lead to.There are many common features ,and some nuances of median lines which each individual can develop as per his trading style.
There are purist traders who trade only with median lines and patterns for confirming support and resistances at the Median Line, Upper median line parallel and Lower median line parallel.
It can also be combined with Fibonacci ratios,Moving Averages, Stoch Indicator for identifying swings and exit entry points.
The approach while using ML is to anticipate when price reaches the S/R , as to where it can go.The clues to identify will be previous horizontal S/R points, trendlines, retracements,breakout of minor swings etc.Also, patterns like congestion of bars, ledges, 123 patterns can be used for confirmation and trade entries/exits.
Using median lines on a chart is like drawing a road map to ascertain where price is going.The strength, weakness of the trends can be identified by drawing the lines and where the reversals can take place.
Drawing the Median Lines
Pivots are the starting points in drawing the Median line set.
Pivots can be defined as the turning points in charts.
They can be
- selected visually where the swings are identified with low and highs
- Pivot Bar should make a higher high and the bar after the pivot making a lower high .
- The High pivot bar will have previous 2 bars with lower highs and subsequent bars making lower highs / and vice versa for a low pivot
Swings
Lines between two pivots will be a swing.Smallest swing in a chart in a time frame will be a minor swing.
Combination of swings will make a major swing.A major swing direction will change when a minor swing high / swing low is crossed by the next swing high / low.
So we identify the pivots and mark the minor and major swings in the Chart.
The simple rule to identify the trend is that the trend is up when we are making higher highs and higher lows and vice versa for downtrend.
The Median lines can be used effectively only when they are drawn to encompass the trends already present .When we draw the median set and the price has bounced off the support and resistance levels at the UMLH and LMLH and the Median line, then we can presume the median line set which has been tested will for a good map for the trends into the future.This is very effective in long term daily and weekly charts.
For short term trading, the same concept applies and we identify the trend based on the previous 5-8 swings , but can be done with a minimum of 3 swings.For very short term intra day trades , we can keep working out the forks for smaller swings also.But of course it has to be combined with other patterns to confirm entries and exits.
See below some charts where price meets the median lines and reversals are identified.
Tuesday, September 27, 2011
27.09.2011_Tuesday
The gap open was a surprise, but with the global markets moves,was probably a possibility.The resistance expected at 4920 was broken on the upside after the first 2 hours and no looking back...
My expectation was a steady rise towards the resistance levels and price bars to show a negative turn which did not happen so did not enter any short trade.Will watch out for resistances at higher levels at 5000-35 range , the next resistance band for any negative cues.
Monday, September 26, 2011
26.09.2011_Monday
A "V" day today.A tussle of war between bulls and bears for the "V"ictory!!Still bears have the upper hand as of now...hmm
"LAZY "Z" PATTERN
Today's 60 min chart showed up a different pattern which is very interesting and would like to share with you.How it pans out tommorrow ,am eager and waiting to see...
This pattern called the "Lazy Z " pattern which Timothy Morge - the median line expert outlined in one of his Articles in detail.Based on the same , I'll run through this chart..
The traditional method for buying at a prior support is when price touches it and putting a stoploss below.If price plunges through the low, one get's stopped out.The reason,breakout traders, enter new short positions.These new short orders push the price lower,and executing stoploss orders left by those who have long positions at the "percieved" support.But once,the breakout traders orders and the stoploss orders are done, price moves back above the trendline and heads higher - as the new short positions entered on the break below begin to get stopped out!This Timothy Morge calls it getting washed and rinsed!
His description of the Lazy Z pattern:
1.Price makes a new low for the move,zooming through a median line or trend line.
2.Because New short positions were taken by the breakout traders, a wash and rinse rally ensues,shaking out the "weak"positions.
3.Once the new weak short positions are washed out of the market,price goes on to make new lows for the move.
We now wait for a retest of the Median /Trendline and sell at that point.The stoploss would be above the previous minor swing high.The stoploss should be protected , as when prices move up again we'll again have another round of sellers entering on retest of the swing high and push prices lower.Only if the move is strong , our position will get stopped out.So the trade decision is well planned one against the one when we enter Buy on retest of earlier supports / or Sell on breakdown of earlier support as a small stoploss point cannot be defined as per price bars.
Here in the Nifty Chart ,
1.At 4911 , previous Swing Low percieved as a buy point / support for the down move buyers would have entered with stoploss below.
2.Next day , the price plunges through the median line support,hitting stoploss points of buyers and new short position buyers ,dragging it to a new low.
3.Once the selling stops , the price moves up,picking up the stoploss of sellers and heads higher to hit the Median line.
4.Here we find price hitting resistance with prices again moving down,so sellers/short positions are being established again and pushing price to new Low.This confirms the presence of more sellers in the market.
The day ends with again a short covering rally closing near the Median Line.The pattern now is to Sell at the retest of the Median line / closer to the previous minor swing high .The stoploss would be above the minor Swing High.The new move towards the downside can be expected when the momentum builds up with more sellers trying to sell closer to test of the swing high.
Hope you enjoyed this Post!!
My plan would be to sell at the range between 4920-4900.In the event price does not reach this range,would prefer to enter the break of the midpoint of the swing from 4759 to close of today.
Saturday, September 24, 2011
Short term Trade-State bank of India followup
Working on the SBI 60 min chart in the weekend .Last week I posted the chart and here's the followup chart and what I forsee may unfold...Before that, some may not be able to understand the chart with so many lines and wonder what the !! this is all about...But Median lines is a wonderful concept which does capture harmonic nature of the the markets swings .It will just need practise with drawing the median lines on charts and studying the interactions of the price bars with them.
I have been following Timothy Morge,( a trader who has been using median line concept extensively),his articles where he explains so lucidly how to analyse the charts and look for trades.The articles are priceless and will give you an insight on how this alternate method can be used for trading as against systems and tables computing numbers.(One can combine / integrate them into a method..it's upto each trader's choice...I too combine the median lines with Moving averages, Stoch indicators..More about it in the following posts..)
The trader should not allow his opinion to cloud his trades on one direction only.Both probabilities should always be looked into, and entry points to be defined with the minimum stoploss point.So here's the recent SBI chart below..
Last chart, the 1900 range was spotted as the breakdown point.The next day, it held on well and climbed up to reach well beyond our target at the Upper Median Line parallel-(UMLH) to reach higher and hitting the sloping magenta trendline of the two previous highs:-).Price gapped down further and hit a low( Point L) very close to the red median line.As on 23rd September it has retraced 61.8% of the downfall.(Point M)
What next??
Drawn a green Schiff median line( A median line set where the pivot where we start drawing the median line is shifted to 50 % R point of the previous swing )
Price has touched the Median Line and closed slightly lower than the close.This is also near the red UMLH.So , a point of resistance.How I look at this wave pattern is, the fall from high to Point L was a straight fall, an impulsive wave.The next wave has retraced it to reach 61.8 %.Assuming a 3 wave pattern to develop for the swing to be completed, one probability is the price to fall down is till Point N.But wait, at the green upsloping Pitchfork at the Point F there could be support - we have been earlier supported at this point (horizontal at Point L).So if support at F holds, the climb could move on to Point G and further up till it meets the Blue median Line at around 2000 levels.There it meets up with the resistance at the Blue and Green Line, Trendline of Highs and expect it to fall down till Point I,and then near to Point O.If Point O at the blue Lower Median line holds up then upmove can commence.
If Point F breaks then the target would be Point N, O and then Point P.
How did I arrive at point P?.
1.The breakdown of point F is a H & S breakdown and the height of the rise will be approx equal to the fall.
2.Parallel to the trendline drawn at highs drawn a magenta parallel trendline from the higher low ( where blue the median line starts).The intersection of this line with the bottom price gives the target zone where the price can fall down to and halt.If the point N holds well, then we would have an Inverted H & S pattern which would augur well for an upmove.
I hope I've not made it look very complicated, as I've just run through various possibilities for the price moves.Again Market is supreme and we have to take care of our capital with stoploss for every trade decision.
Friday, September 23, 2011
23.09.2011
Thursday, September 22, 2011
22.09.2011_Thursday
What a day!!
The fall expected has come a few days later , and the intensity was so fierce and raced downwards to ultimately stop near 4900 levels.
What do my median Lines indicate for the next moves.Obviously the down move is going to extend further but worked on the probabilities of the pattern in which this downmove may unfold.
Referring my chart, marked the important pivots as A,B,C,D,E,F,G till the recent height at 5168.
after the gap down, first blue downsloping pitchfork was drawn.Price bar has moved past the LMLH of the blue median line.Going to the next higher swing pitchfork, the magenta downsloping Pitchfork is drawn.Here the price bar has met the magenta ML and paused today.
What next?
Probabilities...
1.Median lines are possible support points .So after the deep fall, a minor bounce can happen.If so it can reach upto 5000-5020 levels.From there , the price can go down towards 4700-4680 range.
2.Price gaps down on Friday, reaches the Warning line parallel of the blue APF at say 4850 levels, bounce till 4900 and fall down further towards 4700-4680 .
I work out my levels as round numbers only around the parallel lines of the pitchfork and finetune based on chart patterns around them as the prices unfold.Fibonacci numbers for swings are also projected and when they match the median line levels, it is a double confirmation like other systems where 2-3 indicators are used to confirm signals.
Wednesday, September 21, 2011
21.09.2011_Wednesday
Basics of Median Lines
Median Lines as a Price Magnet
History of the Median Line Method
( excerpted from book by Greg Fisher on "Using Median Lines as a Trading tool")
The Median Line method was developed by Alan H.Andrews to assess the market direction by drawing a single line on the chart of any stock.His study of the method determined price action returned to the Median line 80% of the time.
He created a course called Action- Reaction Course in the 1960's and 1970's for students and hi called his method the Median Line Method.
Andrews believed the markets exhibited an order that could be identified.
“Of the two kinds of change in the Universe, flowing change and random change, we are indebted to Newton's invention of Calculus that enables us to find out in advance the conditions that flowing change will produce in the future. His discovery of the natural law that Action and Reaction are equal and opposite in the field of physics also has been applied in the Course to the random changes of price movements in free markets. This application of the Action-Reaction law enables you to learn in advance where the probable reversals of price trends will come in the future.”
“When we speak of any scientific law, we mean a statement that a relationship has been observed among certain given conditions. We mean, "if these conditions now, then those conditions follow, and can be expressed mathematically". We have "order" through which we can know the outcome from these conditions. We can therefore take advantage of this knowledge, and thereby progress and profit.”
“So Newton was one of the great discoverers of this "orderliness" that underlies all of the Creator's work, even if we are often slow in discovering it. Newton's Laws therefore as stated above, have benefited the users in both flowing and random changes.”
Andrews original course states five observations concerning the Median Line (ML).
“There is a high probability that:
1.prices will reach the latest ML
2.prices will either reverse on meeting the ML or gap through it
3.when prices pass through the ML, they will pull back to it
4.when prices reverse before reaching the ML, leaving a “space”, they will move more in the opposite direction than when prices were rising toward the ML
5.prices reverse at any ML or extension of a prior ML.
The book is available free "Using Median Lines as a Trading tool"on the net and those interested can download and read the material.
The original Alan Andrews course material is also available at www.trading-naked.com and should definitely be studied for a greater understanding of the concepts.
I hope you will also be enthralled by this method as I did , though in this age of computer algo trading and mechanical trading , one will have to have patience to understand the concepts, practice and trade realtime with a system created around is method . Hope my sharing of my experiences will help.
Tuesday, September 20, 2011
20.09.2011_Tuesday
The band 5050 - 5020 gave support at the Blue Median Line of the larger Pitchfork and climbed up throught the resistance expected at 5073.
The immediate downmove is negated till it breaches 5020 on the downside.
The momentum looks good today and it can continue and price can reach the upper side at 5320 - 5340 band in the coming days.
The rise is worked out assuming the ongoing wave DE will be equal to wave BC.
This chart has a combination of the trendline channel and the Andrews Pitchfork channel also.
Monday, September 19, 2011
Sunday, September 18, 2011
Entering Short term Trades
State Bank of India Chart example
Let me run through a recent 60 min chart with entry and exit points for trades using Median lines and the concept of Warning Lines.
I have drawn an ascending Pitchfork from a low in August through the mid point of a retracement swing after the price bar crossed 38.2 % R.Buy position entered when price crosses signal bar high.Target reached very close to median line.
Afterwards, the price has moved in a range, a ledge like formation.two probabilites at this point- Breakout above range, continuation of Long trade / New buy position.
Taken a long at the breakout price above the range which happened within the channel, booked the position with the stoploss .
Breakdown of range- Entering Short position.
In this case, price moving out of the Ascending pitchfork and breaking down confirms a good entry point for the Short.
The next Pitchfork , now Descending is drawn.Price hits the Median line and moves further down towards the Lower Median Line Parallel.Part profit booked for Short.
Here I'd like to introduce another concept of median line followed.This is called as warning lines for the extensions of the swings beyond the parallel Lines.This is drawn with distance equal to the distance between the Lower median line parallel and the median line and Upper median Line parallel.
These are also support or resistance lines similar to the LMLH and UMLH and are drawn when price moves out / breaks out of the channel.
In this instance, the price moved down to the first warning line for the profit .
A blue Pitchfork is drawn with Pivot C from the low point of the previous larger swing.( as clear minor swing pivots were not formed in the chart.)
Now,Price has climbed up upto the Blue median line where resistance is expected.
The next few price bars close will determine the next trade decision.The probability exists that it can climb upto the red UMLH where again it meets up with resistance.
So in both cases , short trade entries is being looked out for.
Example of Median Lines in an Uptrend
Attached below is a daily chart of State Bank of India to illustrate the median line concepts to use in taking a decision to enter and exit positions.
There is a double bottom and a series of higher pivots and lower pivots formed, so the view is that the stock is in an uptrend.
When the swing AB is formed and the price starts moving up 38.2% retracement of AB, we draw the Median Line set.The price bar which crosses 38.2% R is the signal bar.
The price action after this point is watched out for either a retest of the Lower Median line parallel or breakout of the signal Bar high.
In this case the price touched the LMLH in the next day and a Buy position with Stoploss of the point B could be entered.
(or) a Buy could be taken at the breakout of signal bar with Stoploss as Low of the Signal Bar.
The discipline to enter positions with a smaller stoploss point is important, as in trading markets, nobody can predict the price moves.
The targets will be when the price bars meet the Median Line.In this case ,after meeting the Median Line there was a consolidation and the breakout of a price bar which met the ML was a good entry point for adding positions or a new Buy.
Point 1 and 2 are the points to book profits.
Example of charting and understanding trend
Here I've attached a nifty daily chart with the Median line drawn with Upper median line parallel and Lower median Line parallel.
How do we interpret and form an opinion of the trend and where the prices are heading?
We start the median line from an important pivot point and draw the line through 50 % of the next major retracement / swing.Parallel Lines are drawn equidistant from the Median Line through the extreme pivots of the retracement swing.The Median line set can be drawn as soon as the price crosses 38.2% R of the retracement swing.
Now , the Lines are ascending and we call this an Ascending Pitchfork and the trend is moving up as long as the price is contained within these parallel channels.
The Price will not move up in a straight line and will alternate between rallies, retracements and consolidation periods .
The basic concept for the trade Decisions are
1.Lower Median Line parallel is a support Line.Testing and retesting of this line gives a good entry Point for Buy.
2.When Price climbs up and meets Median line,
2a.It will meet with Resistance and retrace the upswing recently completed.
The retracement can reach the Lower Median line parallel again or after a minor swing down can breakout of the previousminor swing pivot.So the breakout can be another Buy Entry point.
2b.The price consolidates for a longer period within a range.The breakout of this range Gives a good BUY Entry point.
2c.The price zooms through the median Line.It indicates a strong trend and price has a probability of reaching the Upper median line parallel.So adding to positions can be done.
3.Upper Median Line Parallel is the resistance for the upmove.When Price meets the UMLH , one can book profits on Long positions.
3a.On meeting the UMLH, a red candle indicates the trend reversal.One should wait for a retest of the high, formation of a lower high, or breakdown of a minor swing retracement and go short.The first target will again be the price bar meeting the Median Line.
The Price need not meet the UMLH.The formations of swings at the upper channel and the breakdown into the Lower channel will give the indication the trend is reversing.
So the next step is to look out for formations where we can short the stock / index.
At the beginning of any trend , we cannot assess the strength straightaway, so we need to enter trades with always the stoploss in mind.Price patterns, Breakouts ,volumes give hints about the trend direction.
In Median Line System, we look out for patterns Like 123 pattern, Breakouts of Minor Swings highs,minor swing lows to enter a trade with a minimum stoploss.
In the attached example chart, there is a minor retracement at 50 % level of Retracement and breakout of the swing high gave a good Buy entry point with the swing low as the Stoploss.
When it reaches the Median Line, there will be a resistance and this point is the place to book part profits.The price patterns at the Median Line which have to be watched out for
1.Reversal
2.Consolidation
3.Breakout
At the median Line the trade decision will have to be taken based on the above.
Again coming back to the example chart, the price retraced from the Median line and reversed again.The breakout of the Swing High at the Median Line gave a second entry for Buy position.
The price goes through a consolidation mode and after touching the Lower Median Line parallel climbs up again.Now the breakout of the previous sminor swing high gives another Buy Entry point.The meeting point of Price Bar at the Median Line will be the part profit booking target.
Some simple tips to follow would be :
Ascending Pitchfork: Up Trend , Look out for BUY trades ( trend trades)
Descending PitchFork:Down Trend , Look out for Sell trades
Saturday, September 17, 2011
Resources to learn Median Line trading
Resources for learning more about Median Line trading..
1.Best Trendline methods of Andrews by Mikula forecasting
This book will give an insight of how Median lines can be used for trading, finding entries and targets .Right from the basic concepts to the trade setups the book is a good reference to build a system.
2.Timothy Morge is a professional trader of 39 years experience and has been actively using and sharing his knowledge about median line trading .He has some wonderful websites ,
www.medianline.com and www.marketgeometry.com which can be accessed for loads of information, charts and articles which with patient study throws up gems to use ourselves.
My blog also has information about the above.
Median Line System for Trading
The method of trading with Median Lines,also called as Andrews pitchfork has been called as one of the leading indicators which can be used to predict high probability price targets .Combining it with trading rules / money management the method can be used as a good system.It can be used in all time frames, and gives very good entries and exits for positional trades.
The method is suitable for traders who prefer to use charts for their technical analysis for calculating their levels.It's basically a VISUAL method with price patterns against systems which use Numbers / ratios for finetuning levels.
Median Lines can be used in combination with Fibonacci ratios very effectively for trade setups.
I have learnt about this interesting system over the years with information on the internet and trading with the concepts and setups which I have evolved from the knowledge.The system performs well as in any other system only when we trade with rules , stoploss mechanism and money management.
Let me move on to the basic concepts..
Median line studies utilizes the concepts of support, resistance, and retracements .
Median Line method also called as Andrew's Pitchfork was developed by Alan H.Andrews.
Andrews' Pitchfork is a trend channel tool consisting of three lines.
The lines formed can help predict channels of support and resistance in a trending market.There is a median trendline in the center with two parallel equidistant trendlines on either side. These lines are drawn by selecting three points, usually based on reaction highs or lows moving from left to right on the chart. As with normal trendlines and channels, the outside trendlines mark potential support and resistance areas. A trend remains in place as long as the Pitchfork channel holds. Reversals occur when prices break out of a Pitchfork channel.
How to draw Median Lines
1.Identify a significant ( high or Low) reversal point- this becomes Point A.
2. Draw a line from this point to the next significant reversal point at Point B.
3.Then plot a line from a significant point early in the trend ( Point C) bisecting the first line halfway between A & B.This is the Median Line.
4.Now draw two lines parallel to the Median line, one starting from Pt A and other from Pt B.
5.These form the Median line set / channels or Andrews Pitchfork.
How to draw the charts
1.There are many stock charting programs which have Andrews pitchfork tool.
2.Web based charts programs like Icharts.in have line tools where the APF line can be drawn and saved.
2.Copy charts and paste them in Paint program and draw the lines.( But this is a time consuming process for short term trades.However can be used for longterm trades /positional trades.
Friday, September 16, 2011
16.09.2011_Friday
Thursday, September 15, 2011
15.09.2011_Thursday
Hourly chart 15.09.2011
Well...Nifty dances always differently than what we anticipate.
Instead of the fall towards 4750, past two days price action with the volatile rallies and fall, difficult to take a call and sit tight. Getting into trades with stoploss getting hit both ways will only be the result of volatile movements.
However, the median lines has given an outline for the direction.As price did not breach 4911 low, the consolidation and the rise in the upsloping blue channel indicates the short term upmove till 5100-5150 levels as expected earlier.Beyond 5150 - above 5175 then further upmove should unfold, otherwise the great fall till 4700 should materialise.Watching out 5100-5150 band for the resistance.
Tuesday, September 13, 2011
Sunday, September 11, 2011
12.09.2011_Monday
Daily Chart
Last weeks price action - Made a low earlier in the week and zoomed above median line and has closed near the median line at 5059 levels.
For a long term upmove the retest of low of 4720 is expected.So next week the price can attempt to go down till 4850 - 4800 levels.
Trade Outlook : Sell at 5120-5150 levels for targets 4850 levels and lower
.So beginning of week expect the price to move up to retest the swing high .
Stoploss for sell will be at 5160.
SAR - 5175 for targets 5400 levels.
Hourly chart projections
Charting the hourly with the median lines , with the momentum of the last days move , price can attempt testing 5000 levels , bounce back to 5100 - 5150 levels and then fall down further towards 4850.If it breaksout of 5175 after touching 5000 then upmove can be expected upto 5400 levels.
Trade Plan:
1.If price reaches 5100-5150 levels on Monday / Tuesday then,
1.a.Sell sept futures at 5120-5150 levels + Sell PE 5200 at 5120 levels - SL 5160.
Target 4850 ...Stoploss 5160. SAR 5175
When in profit by 50 points close PE 5200 and sell PE 5000.
2.If price reaches 5000 levels on Monday / Tuesday then,
2.a.Buy Sept futures at 5000 levels + Sell 4900 CE at 5000 levels - SL 4950
Target 5100-5150..Stoploss 4950. SAR 4940
When in profit by 50 points close CE 4900 and sell CE 5200.
Maximum points for stoploss to be 25 points per combination.
Friday, September 2, 2011
2.09.2011_Friday
Weekly chart
Price touched low of 4720 last week close to lower median line ( Schiff ) also a parallel to the trendline connecting highs of previous swing.
This week though short, has give a wide green bar , retracing previous swing.it has touched the downsloping median line.
Two probabilities if bullish
1.The price can zoom through the median line next few weeks to attempt testing of the upper median line till around 5500 levels.
2.Price can retrace till 4850 levels and then continue upward journey .Upper side targets will be at approx 5200 -5400 levels.
If bearish
3.the price breaks down through 4720 - swing low, then lower levels targets can be 4500 - where it touched the Lower median line parallel of the larger APF .Further downside can be worked out as the the chart evolves.
Hourly chart
Trade Plan for next week
Futures + options Covered call/ put trades.This is the basic plan but entry prices will have to be finetuned as per premium of calls / puts.Stoploss for future will be 30 points and calls / puts closed.
1.Sell 2 lots Sept futures @ 5100 levels + Sell Sept PE 4900 , Sell Sept PE 4800 - Target 4850 levels .
2.Buy 2 lots Sept future @ 4850 levels + Sell Sept CE 5100- 1 lot , Sept CE 5200 - 1 lot - Target 5200-5350 levels .
3.If price breakdown , Sell 2 lots Sept futures below4720 levels , Sell Sept PE 4500 / 4400 1 lot @.
Subscribe to:
Posts (Atom)