Trading with Median lines is a system and a leading indicator suitable for Swing trading.I am following this strategy for Nifty and Bank Nifty with good results.Those interested to trade with Charts and Price action to analyse target price, support and resistance levels will find this strategy very interesting.

Feedback welcome!Happy trading...

Friday, December 31, 2010

Nifty moves on...


Nifty closed at 6134 with day high at 6145.Steady move up on expected lines / targets.
Daily Chart 31.12.10

60 min chart


I have marked the previous swing CD.Prices are moving steady within the Andrews pitchfork (thro DE from C ).The calculation of 2 times swing range CD from point E gives a target price of 6194 .This target is close to the confluence of the blue mini median line and the longterm median Line (orange).
At this major median Line resistance is expected.If we get a zoom thro bar then higher targets are probable.The possibility of reaching earlier highs looks very positive if it moves past 6200 levels.

Thursday, December 30, 2010

Nifty charging up..


Morning moves were within a range but last hour Nifty really charged up to reach 6100 levels.
Positive moves expected for the new series from tommorrow towards the higher targets.
Daily Chart 30.12.10

5 min chart 30.12.10


Studying the movement in 5 min chart , the prices are moving up wihin the ascending green pitchfork.The price reached very close to the median line at C and this point corresponds close to 1.382% fib levels of the previous swing AB.Fib levels work very well with median lines to project / confirm target levels.

Wednesday, December 29, 2010

Nifty crosses the first hurdle

Nifty Daily chart 29.12.10
The price successfully crossed the hurdle at 6045 .The steady move upwards since morning session right through the day indicates positive mood coming in .
The green bar moved right into the blue PF and the LMLH has supported well for the past few days.

60 min chart

Studying the slope angle of the previous upswings from the last major low of 5721 , it can be noted the price moves are so much in the same angle as the previous swing angles!
Projecting a similar swing, the confluence with the UMLH gives a target of 6170- 6180 levels.
Outlook for tommorrow
A very positive move up, maybe even a gap up is expected.Upper targets are 6100 / 6140 / 6170 / 6200 over the next two days.
Stoploss for long positions will be at 5975 .


Monday, December 27, 2010

Nifty still clueless...

Daily Chart 27.12.10
Nifty made a higher high today but closed below yesterday's close.The direction of Nifty is still without much clues and the plan will be to be prepared for whichever direction it moves.
Looking at the daily chart, Price has held on to the LMLH , within the lower channel.A break of this line can lead to lower prices in a sideways range for the next few days.Low of friday at 5940 levels should be a good support for any down moves.
15 min chartLooking at the 15 min chart, Blue pitchfork with pivots at C ,D,E was drawn to analyse the price movement.Todays high did not touch the ML of this blue PF and a down swing towards LMLH till close of the day.The price has touched and crossed the LMLH.
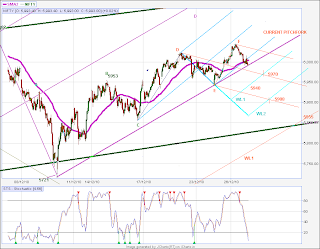
Projected the WL1 and WL2 ( Reaction lines ) for targets for the down move.
Projected the Orange PF with pivots D,E,F ( Today's high) to chart the current price movement.Targets of 5970-5960,5940 ( earlier low),5908 are projected from confluence of PF and Warning Lines.
Outook for 28.12.2010:

Above todays high 6045 - Positive moves expected , with strong close Long position can be taken.
Resistance at 6030 and breakout below 5980 will lead to lower targets projected in 15 min chart ie 5960 / 5940/5908.
Till 5850 levels the moves can be categorised as corrective and below 5850 the trend becomes negative again.


Friday, December 24, 2010

Nifty inching up....


Todays move by nifty was a good rise from the low made in the morning.It's a typical Buy day with the lower low than yesterday made in the morning session and closing higher than yesterday.The probability of a good gap opening on Monday is very high.
60 min chart

The prices got supported at the Lower Median line Parallel (LMLH ) . The price action looks set to go upwards till it is within this ascending green pitchfork .Trend can reverse when this trendline is broken.
Higher targets are at 6037 / 6100 / 6140 / 6160 levels.

Thursday, December 23, 2010

Nifty yet to decide its direction!

The sharp movement late afternoon yesterday gave an indication that sharp moves may be expected today but the market proved otherwise today.The small range in which it traded was a good lesson in patience, which is the trait that traders are supposed to master!

As the expected down move till 5930 levels did not materialise , I closed my short position as EOD the symmetrical triangle pattern made me doubtful of the direction of the move.Preferred to wait out and join the move once nifty decides whichever way!
Outlook for tommorrow:
The price can move towards 5950-5930 levels , find support and move upwards.This is the positive bias.And it should be a very sharp move through the main ML ( daily chart) for the upmove to gather momentum and race up.
Negative Bias will be a breakdown of 5930 levels .Supports further down are at 5865 / 5780 levels.
Will wait on price moves tommorrow for further action.


Wednesday, December 22, 2010

Nifty at Crossroad...

Nifty at Crossroads...

Daily chart 22.11.10


The pivots are marked on the daily chart .P0 is the anchor and P1-P2 is the swing line through which the first major descending pitchfork is drawn.Subsequent pitchforks are also show with pivots P3,P4,P5 .The median rules specifically
- the prices will reverse to meet the median line 80% of time is illustrated very well in this chart.
- Prices get supported at Lower Median line Parallel(LMLH) and resisted at Upper median line parallel( UMLH) is also seen.
All pivots are still within this major red descending pitchfork in the short term.
Today's price meets the UMLH , and this could be a probable pivot P6.Confirmation of this level as a pivot would be a lower close for the next two days .Supports probable at 5960 - 5930 levels.After support the prices move upwards of the red UMLH with strong close the trend upwards can continue for higher targets.

60 Min chart

The price today broke down from the mini median line pitchfork drawn within the current swing.Supports expected at the ascending green pitchfork drawn on 60 min chart at 5950 - 5930 levels.

15 min chart
Connected todays high and the previous swing high with a trendline.The parallel to this trendline drawn from previous low and red pitchfork confluence gives a target of 5930 for this downmove.