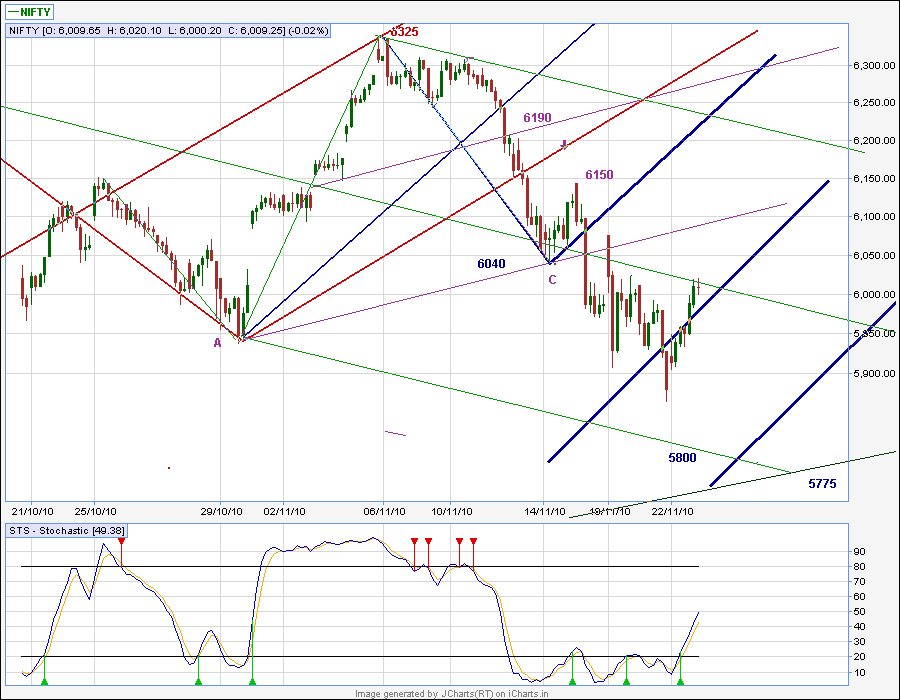
The Nifty had a good pullback from 5900 to 6000 levels today. 6000 levels is the price where it touched the green median line which can be a probable resistance point. If it does not pierce thro tommorrow in the first one hour, expecting up down movement around these levels for some time.
60 min chart
 15 min chart:Showing the descending magenta pitchfork and the breakout at 5875 levels.
 15 min chart: With median lines showing probabilities of movement of nifty after breakout today.
 If it closes above 6040-6050 levels tommorrow then target of 6155 / 6215 expected.
Outlook:
If unable to break above 6000 levels it can down below to 5960 then 5930 levels expected.
5930 should hold for further upmove to unfold.If at 5930 nifty goes up , probable head and shoulder pattern with breakout at 6020 level can be a possibility.
Below 5930 , the downward journey can resume for levels of 5870 / 5750 where the correction from 6325 levels should be put on hold.
Hi Kavima,
ReplyDeleteExcellant analysis. By the way, what is your set up fro Stochastic for Day, 60 min. and 15 min?
Regards,
Veer
hi veer
ReplyDeleteI use stoch 35,3,3 settings in icharts in all the time frames.However my analysis for oversold / overbought readings of prices are based on the time frame .My trade entry and exits are planned when they meet the median lines / action reaction lines.I project the probable median lines for the next wave targets.
regs