Nifty at Crossroads...
Daily chart 22.11.10
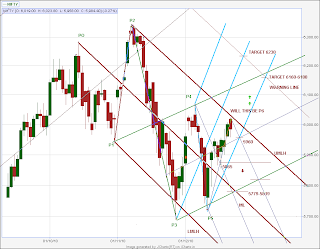


The pivots are marked on the daily chart .P0 is the anchor and P1-P2 is the swing line through which the first major descending pitchfork is drawn.Subsequent pitchforks are also show with pivots P3,P4,P5 .The median rules specifically
- the prices will reverse to meet the median line 80% of time is illustrated very well in this chart.
- Prices get supported at Lower Median line Parallel(LMLH) and resisted at Upper median line parallel( UMLH) is also seen.
All pivots are still within this major red descending pitchfork in the short term.
Today's price meets the UMLH , and this could be a probable pivot P6.Confirmation of this level as a pivot would be a lower close for the next two days .Supports probable at 5960 - 5930 levels.After support the prices move upwards of the red UMLH with strong close the trend upwards can continue for higher targets.
60 Min chart

The price today broke down from the mini median line pitchfork drawn within the current swing.Supports expected at the ascending green pitchfork drawn on 60 min chart at 5950 - 5930 levels.
15 min chart
Connected todays high and the previous swing high with a trendline.The parallel to this trendline drawn from previous low and red pitchfork confluence gives a target of 5930 for this downmove.

Hi Kavima,
ReplyDeleteNice Analysis. Would like to take long @5930 with SL @5910 and see.
A small request the 60 minutes and 15 minutes are not magnifiable. Like the daily charts if you can do these two also, the figures will be visible.
Regards,
Veer
hi veer
ReplyDeletereposted the charts.
I wil prefer to wait to go long till it moves past 6030 levels ie yesterdays high.Lets watch the game.Downside it can reach till 5850 for support.Currently i'm holding short positions for these targets.
Below 5850 will have a bearish view.
Hi Kavima,
ReplyDeleteThank you.
Veer